At the beginning of 2021, there was broad consensus U.S. corporations would post a strong earnings’ rebound, and many believed interest rates would move higher alongside economic growth and rising inflation. Market participants set expectations for both outcomes.
Checking in a little more than halfway through the year, I think we can make two observations: earnings have been higher-than-expected, while interest rates continue to be lower-than-expected. If you’re looking for a succinct explanation for why the S&P 500 index is up close to 20% for the year, I think that’s it.
There are always many moving parts when it comes to analyzing the equity markets, of course, but the two factors I think that matter the most are earnings and interest rates. Everything else we see and read in the financial news—the good and the bad, the valued fundamental indicators and the noise—only matter, in my view, if they affect how earnings and/or interest rates will change in the future. The current situation in Afghanistan, for instance, may feel like a huge deal, but I see very little possibility of it affecting U.S. earnings or interest rates in 2021. To me, it is an important geopolitical event, but it has no pricing power.1
__________________________________________________________________________
Are You Managing Your Expectations in a Market Full of Surprises?
It’s always a positive when the market turns out “better-than-expected,” but what happens when the market plunges? What can investors do to protect their investments?
Get answers to these questions and more with our just-released Stock Market Outlook report. This report contains some of our key forecasts to consider such as:
- Zacks rank S&P 500 sector picks
- Zacks view on equity markets
- What produces 2021 optimism?
- Zacks forecasts for the remainder of the year
- Zacks ranks industry tables
- Sell-side and buy-side consensus
- And much more
If you have $500,000 or more to invest and want to learn more about these forecasts, click on the link below to get your free report today!
IT’S FREE. Download the Just-Released September 2021 Stock Market Outlook2
__________________________________________________________________________
On the other hand, when U.S. corporations are performing much better than most analysts expect them to, that does have pricing power. In this Q2 earnings cycle, revenue momentum has been particularly notable, with aggregate quarterly totals on track to reach an all-time high. The charts below show revenue growth rates and earnings and revenue beat percentages for companies that have reported so far, and the percentage of companies beating (right-hand side) really stands out. That’s what “better-than-expected” looks like.
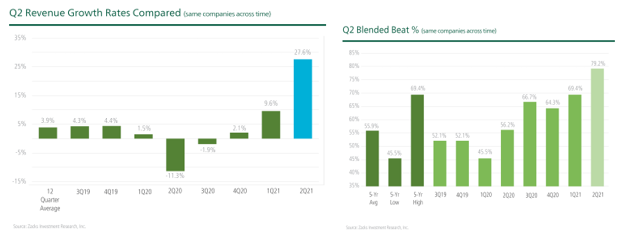
Many point out – correctly – that the strong revenue and earnings growth rates are due to the base effect, i.e., comparing Q2 2021 revenue to Q2 2020 revenue, when the economy was largely shut down. But even when we compare Q2 2021 earnings to Q2 2019 earnings, we find that corporations are on track to post earnings +30.9% higher than they were in 2019, pre-Covid. That is a very significant point that is not discussed often enough, in my view.
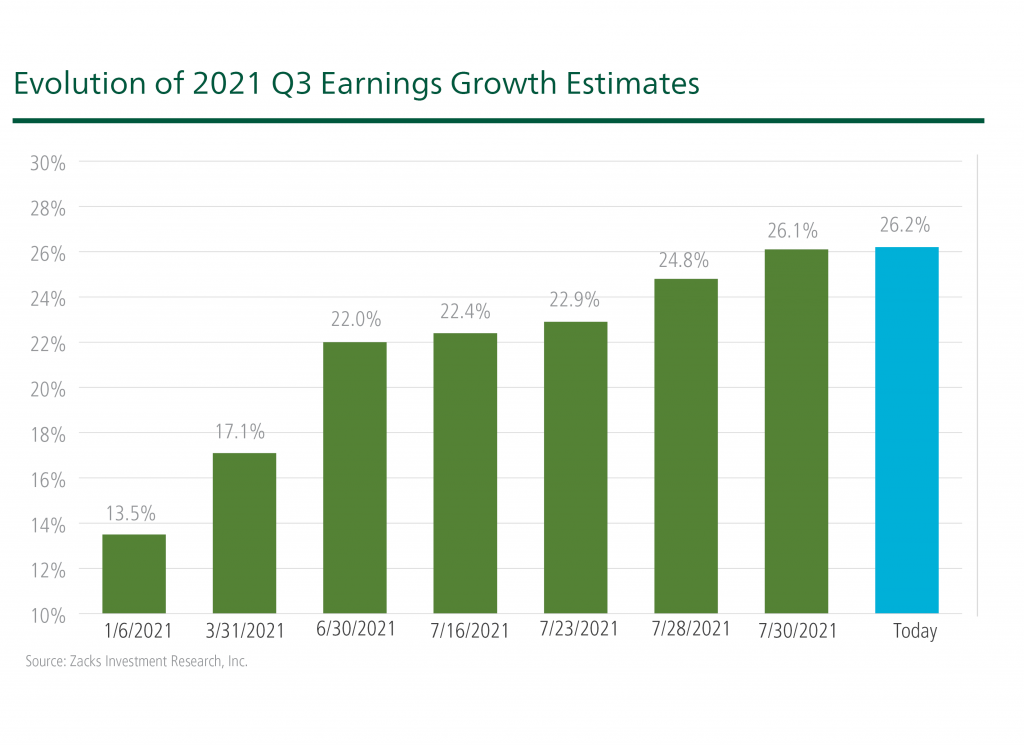
This largely better-than-expected performance from corporations has also resulted in upward revisions to Q3 earnings expectations, which started the year at 13.5% y-o-y growth and have since climbed to 26.2% y-o-y growth. This sustained optimism from corporate America comes even as the Delta variant is dealing a few setbacks to travel, hospitality, restaurant, and other in-person business operations. It’s a strong signal that companies feel able to navigate their way through the next few months.
On the interest rate front, everyone expected longer duration U.S. Treasury bonds to drift higher over the course of the year, and some even expected yields would spike as growth surged and inflation expectations went up. But so far, interest rates have been doing just the opposite. As you can see below in the chart of the 10-year and the 30-year U.S. Treasury bond yields, interest rates briefly drifted higher earlier in the year but have since fallen back.
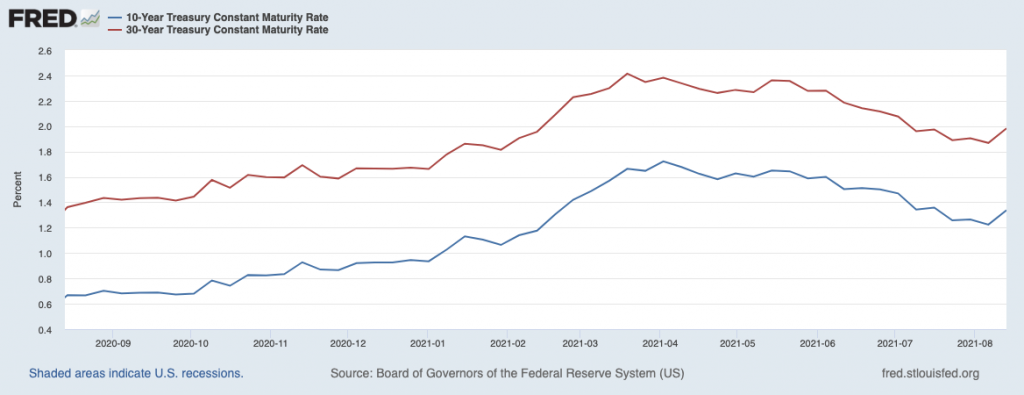
When interest rates ultimately end up lower than everyone expects them to – as we saw in the first half of the year – stock prices usually rise. This time was no different.
Bottom Line for Investors
In my view, the stock market has performed well and reaching new all-time highs because aggregate earnings are coming in higher than expectations, while interest rates are far lower than expectations set earlier in the year. Positive surprises are great for stocks, in my view.
Looking ahead to the second half of the year, I think current expectations are that interest rates should eventually respond to higher inflation, while the corporate profit cycle has reached a peak and is likely poised to decelerate from here. Expecting higher rates and lower earnings may ultimately be a good thing, as it sets the stage for even more positive surprises.
To be prepared for any surprises in the market, whether it’s positive or negative, I recommend staying focused on key economic indicators. Our Just-Released September 2021 Stock Market Outlook Report3, will give you insight into all of it!
This report is packed with newly revised predictions that can help you base your next investment move on hard data. For example, you’ll discover Zacks’ view on:
- Zacks rank S&P 500 sector picks
- Zacks view on equity markets
- What produces 2021 optimism?
- Zacks forecasts for the remainder of the year
- Zacks ranks industry tables
- Sell-side and buy-side consensus
- And much more
If you have $500,000 or more to invest and want to learn more about these forecasts, click on the link below to get your free report today!
Disclosure
2 Zacks Investment Management reserves the right to amend the terms or rescind the free Stock Market Outlook offer at any time and for any reason at its discretion.
3 Zacks Investment Management reserves the right to amend the terms or rescind the free Stock Market Outlook offer at any time and for any reason at its discretion.
DISCLOSURE
Past performance is no guarantee of future results. Inherent in any investment is the potential for loss.
Zacks Investment Management, Inc. is a wholly-owned subsidiary of Zacks Investment Research. Zacks Investment Management is an independent Registered Investment Advisory firm and acts as an investment manager for individuals and institutions. Zacks Investment Research is a provider of earnings data and other financial data to institutions and to individuals.
This material is being provided for informational purposes only and nothing herein constitutes investment, legal, accounting or tax advice, or a recommendation to buy, sell or hold a security. Do not act or rely upon the information and advice given in this publication without seeking the services of competent and professional legal, tax, or accounting counsel. Publication and distribution of this article is not intended to create, and the information contained herein does not constitute, an attorney-client relationship. No recommendation or advice is being given as to whether any investment or strategy is suitable for a particular investor. It should not be assumed that any investments in securities, companies, sectors or markets identified and described were or will be profitable. All information is current as of the date of herein and is subject to change without notice. Any views or opinions expressed may not reflect those of the firm as a whole.
Any projections, targets, or estimates in this report are forward looking statements and are based on the firm’s research, analysis, and assumptions. Due to rapidly changing market conditions and the complexity of investment decisions, supplemental information and other sources may be required to make informed investment decisions based on your individual investment objectives and suitability specifications. All expressions of opinions are subject to change without notice. Clients should seek financial advice regarding the appropriateness of investing in any security or investment strategy discussed in this presentation.
Certain economic and market information contained herein has been obtained from published sources prepared by other parties. Zacks Investment Management does not assume any responsibility for the accuracy or completeness of such information. Further, no third party has assumed responsibility for independently verifying the information contained herein and accordingly no such persons make any representations with respect to the accuracy, completeness or reasonableness of the information provided herein. Unless otherwise indicated, market analysis and conclusions are based upon opinions or assumptions that Zacks Investment Management considers to be reasonable. Any investment inherently involves a high degree of risk, beyond any specific risks discussed herein.
The S&P 500 Index is a well-known, unmanaged index of the prices of 500 large-company common stocks, mainly blue-chip stocks, selected by Standard & Poor’s. The S&P 500 Index assumes reinvestment of dividends but does not reflect advisory fees. The volatility of the benchmark may be materially different from the individual performance obtained by a specific investor. An investor cannot invest directly in an index.
The MSCI ACWI captures large and mid-cap representation across 23 Developed Markets (DM) and 27 Emerging Markets (EM) countries. With 2,986 constituents, the index covers approximately 85% of the global investable equity opportunity set. An investor cannot invest directly in an index. The volatility of the benchmark may be materially different from the individual performance obtained by a specific investor.
The MSCI UK All Cap Index captures large, mid, small and micro-cap representation of the UK market. With 819 constituents, the index is comprehensive, covering approximately 99% of the UK equity universe. An investor cannot invest directly in an index. The volatility of the benchmark may be materially different from the individual performance obtained by a specific investor.
The Russell 1000 Value Index is a well-known, unmanaged index of the prices of 1000 large-company value common stocks selected by Russell. The Russell 1000 Value Index assumes reinvestment of dividends but does not reflect advisory fees. An investor cannot directly invest in an index. The volatility of the benchmark may be materially different from the individual performance obtained by a specific investor.
The Russell 1000 Growth Index is a well-known, unmanaged index of the prices of 1000 large-company growth common stocks selected by Russell. The Russell 1000 Growth Index assumes reinvestment of dividends but does not reflect advisory fees. An investor cannot invest directly in an index. The volatility of the benchmark may be materially different from the individual performance obtained by a specific investor.