We’re in a moment in history where few things seem normal, and there are many unknowns. This dynamic also means that several economic data points (which I’ll detail below) have also moved into ‘first-time-in-history’ territory, which may seem worrisome, but I will argue is not inherently negative. This week’s column will take a look at five interesting facts about the stock market and the economy today, while explaining why each one matters.
Fact #1: Altogether, the balance sheets at global central banks are growing at a 33% year-over-year pace. Here in the U.S. the Fed’s measure of money supply (M2) is growing at a 23% year-over-year pace.1
M2 Money Supply Year-Over-Year Growth in the U.S.
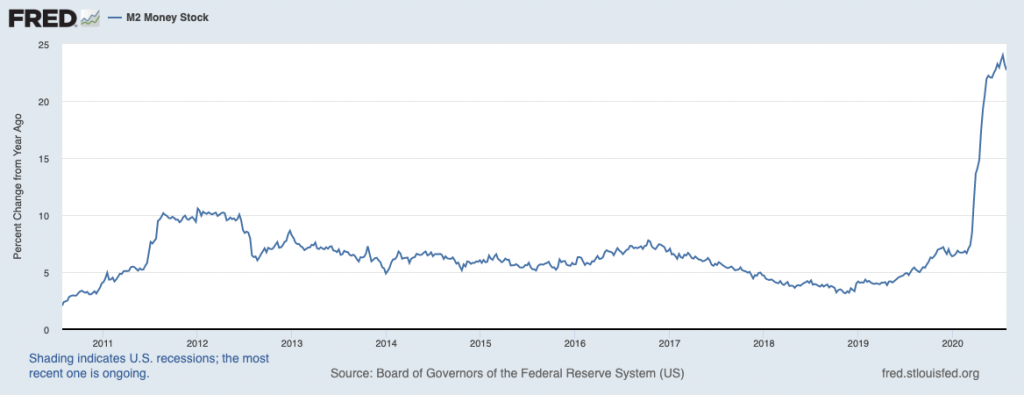
Source: Federal Reserve Bank of St. Louis2
Why this matters: The world is awash in liquidity, and central banks show few signs of letting up. If anything, central banks are likely to expand balance sheets even further in the coming months and quarters, which by itself is a bullish indicator, in my view. I have written before that this liquidity backdrop makes it difficult to be bearish, even if economic data remains weak in the near-term. The well-known phrase “don’t fight the Fed” applies.
_________________________________________________________________________
In Times Like These, Focusing on Data and Not Media Hysteria is Key!
We have passed the middle of 2020, and it has been a chaotic year of events to say the least. Still, there is money to be made. So instead of focusing on the “what if’s” that saturate the media, I recommend staying calm and focusing on the fundamentals. To help you do this, I am offering all readers our just-released Stock Market Outlook report. This report contains some of our key forecasts to consider such as:
- What’s ‘Fair Value’ on the S&P500?
- Setting U.S. returns expectations for the remainder of 2020
- What should you think about COVID19 era jobs data?
- An update on U.S. fiscal stimulus
- Zacks Rank S&P 500 sector picks
- Status of global energy markets
- And much more
If you have $500,000 or more to invest and want to learn more about these forecasts, click on the link below to get your free report today!
IT’S FREE. Download the Just-Released September 2020 Stock Market Outlook3
_________________________________________________________________________
Fact #2: During this ongoing market rally, the five biggest U.S. companies have seen their valuations climb to over 30x earnings.4 The spread between these five companies’ valuations, and the remaining companies in the S&P 500’s valuations, is wide and getting wider.
Why this matters: Many readers have likely seen the stat-lines before – the biggest U.S. companies, largely in the realm of technology, are disproportionately driving returns for the S&P 500. But the real reason these runaway valuations matter, in my view, is that the markets tend to mean revert over time. The last time the spread between the biggest companies’ valuations and the remaining S&P 500 companies’ valuations were this wide was in 2018. A major market correction that year narrowed the gap quickly.
Fact #3: Five of the largest companies in the S&P 500 – MSFT (Microsoft), AMZN (Amazon), GOOG (Google) & FB (Facebook) – make up nearly 25% or a quarter of the S&P 500’s total market cap. For the Russell 1000 Growth Index, these five stocks make up 34% of the index. For the NASDAQ, the number swings up to 48%!5
Why this matters: Though it may feel unsustainable for a handful of companies to account for such a large percentage of an index’s market capitalization, I would note that a correction may ultimately lead to a rotation of capital from high valuation names to low valuation names. In other words, all ships do not necessarily have to sink if the biggest names undergo some selling pressure.
Fact #4: Even though the S&P 500 is nearing new all-time highs, only about a quarter of stocks in the index are within 5% of their own all-time highs. Nearly half of index constituents are over 20% from their all-time highs.6
Why this matters: The takeaway here is similar to the takeaway above, in that a small percentage of stocks have been driving total return for the index. I expect some mean reversion moving forward, and thus believe a diversified approach is very important in the current environment.
Fact #5: At the beginning of earnings season, S&P 500 earnings were forecast to decline -43%.7 The actual outcome has been better than expected.
Why this matters: Anytime outcomes are better than expectations – especially when it comes to earnings – stock prices tend to go up. I think it is fair to assess that better-than-expected earnings have been contributing significantly to the current rally. Total earnings (or aggregate net income) for the 445 S&P 500 members that have reported as of this writing are down -34.8% on -10.9% lower revenues. But 80.2% of these 445 index members have beaten consensus EPS estimates and the corresponding revenue beats percentage is 63.1%, with a blended beats percentage of 56.4%.8
Bottom Line for Investors
Hopefully readers find these data points and takeaways helpful in making sense of the current market. The bottom line here may be that in a world awash in liquidity and with companies doing a little better than expected, the case for a well-diversified portfolio is paramount. In short, now is not the time to go all-in on just the biggest U.S. tech companies, nor is it the time to bet against the U.S. economy, in my view.
This is why it’s important to look at the whole picture and have a diversified approach to your portfolio. To help you do this, I am offering all readers our Just-Released September 2020 Stock Market Outlook Report.
This report not only looks at Tech but highlights several factors that are producing 2020 optimism right now and contains some of our key forecasts to consider such as:
- What’s ‘Fair Value’ on the S&P500?
- Setting U.S. returns expectations for the remainder of 2020
- What should you think about COVID19 era jobs data?
- An update on U.S. fiscal stimulus
- Zacks Rank S&P 500 sector picks
- Status of global energy markets
- And much more
If you have $500,000 or more to invest and want to learn more about these forecasts, click on the link below to get your free report today!9
Disclosure
2 Board of Governors of the Federal Reserve System (US), M2 Money Stock [M2], retrieved from FRED, Federal Reserve Bank of St. Louis; https://fred.stlouisfed.org/series/M2, August 10, 2020.
3 Zacks Investment Management reserves the right to amend the terms or rescind the free Stock Market Outlook offer at any time and for any reason at its discretion.
4 Strategas, Investment Strategy Report, August 10, 2020
5 Strategas, Investment Strategy Report, August 10, 2020
6 Strategas, Investment Strategy Report, August 10, 2020
7 Strategas, Investment Strategy Report, August 10, 2020
8 Strategas, Investment Strategy Report, August 10, 2020
9 Zacks Investment Management reserves the right to amend the terms or rescind the free Stock Market Outlook offer at any time and for any reason at its discretion.
DISCLOSURE
Past performance is no guarantee of future results. Inherent in any investment is the potential for loss.
Zacks Investment Management, Inc. is a wholly-owned subsidiary of Zacks Investment Research. Zacks Investment Management is an independent Registered Investment Advisory firm and acts as an investment manager for individuals and institutions. Zacks Investment Research is a provider of earnings data and other financial data to institutions and to individuals.
This material is being provided for informational purposes only and nothing herein constitutes investment, legal, accounting or tax advice, or a recommendation to buy, sell or hold a security. Do not act or rely upon the information and advice given in this publication without seeking the services of competent and professional legal, tax, or accounting counsel. Publication and distribution of this article is not intended to create, and the information contained herein does not constitute, an attorney-client relationship. No recommendation or advice is being given as to whether any investment or strategy is suitable for a particular investor. It should not be assumed that any investments in securities, companies, sectors or markets identified and described were or will be profitable. All information is current as of the date of herein and is subject to change without notice. Any views or opinions expressed may not reflect those of the firm as a whole.
Any projections, targets, or estimates in this report are forward looking statements and are based on the firm’s research, analysis, and assumptions. Due to rapidly changing market conditions and the complexity of investment decisions, supplemental information and other sources may be required to make informed investment decisions based on your individual investment objectives and suitability specifications. All expressions of opinions are subject to change without notice. Clients should seek financial advice regarding the appropriateness of investing in any security or investment strategy discussed in this presentation.
Certain economic and market information contained herein has been obtained from published sources prepared by other parties. Zacks Investment Management does not assume any responsibility for the accuracy or completeness of such information. Further, no third party has assumed responsibility for independently verifying the information contained herein and accordingly no such persons make any representations with respect to the accuracy, completeness or reasonableness of the information provided herein. Unless otherwise indicated, market analysis and conclusions are based upon opinions or assumptions that Zacks Investment Management considers to be reasonable. Any investment inherently involves a high degree of risk, beyond any specific risks discussed herein.
The S&P 500 Index is a well-known, unmanaged index of the prices of 500 large-company common stocks, mainly blue-chip stocks, selected by Standard & Poor’s. The S&P 500 Index assumes reinvestment of dividends but does not reflect advisory fees. The volatility of the benchmark may be materially different from the individual performance obtained by a specific investor. An investor cannot invest directly in an index.
The Russell 1000 Growth Index is a well-known, unmanaged index of the prices of 1000 large-company growth common stocks selected by Russell. The Russell 1000 Growth Index assumes reinvestment of dividends but does not reflect advisory fees. An investor cannot invest directly in an index. The volatility of the benchmark may be materially different from the individual performance obtained by a specific investor.
Nasdaq Composite Index is the market capitalization-weighted index of over 3,300 common equities listed on the Nasdaq stock exchange. The types of securities in the index include American depositary receipts, common stocks, real estate investment trusts (REITs) and tracking stocks, as well as limited partnership interests. The index includes all Nasdaq-listed stocks that are not derivatives, preferred shares, funds, exchange-traded funds (ETFs) or debenture securities. An investor cannot invest directly in an index. The volatility of the benchmark may be materially different from the individual performance obtained by a specific investor.