Benny A. from Youngstown, OH asks: Hello Mitch, I saw in the news that the U.S. manufacturing sector has been experiencing some major struggles lately. Is this a cause for concern?
Mitch’s Response:
Thanks for your email. You’re correct to point out that factory activity in the U.S. has been in a prolonged slump. According to the Institute for Supply Management’s (ISM) manufacturing gauge, factory activity in the U.S. dropped to a reading of 46, which is the weakest it’s been since May 2020.1
Anything under 50 signals a contraction, and we’re now in the longest period of contraction for manufacturing since 2008-2009, which readers will recognize as years during the Global Financial Crisis.
Explore the Do’s and Don’ts of Stock Market Volatility
How should investors navigate the challenges posed by the fluctuations of market volatility?
It is impossible to avoid volatility, but there are ways you can minimize the worst impacts of a volatile market. In our newest guide, ‘The Do’s and Don’ts of Stock Market Volatility’ we provide recommendations for investors, based on 30 years of expertise. We also explore:
- 3 best practices to successfully manage periods of market volatility
- 3 most common mistakes investors make, and why they are so damaging to your long-term investing goals
- Historical data that supports our conclusions and underscores the recommendations we propose
If you have $500,000 or more to invest, get our free guide today!
Download Your Copy Today: The Do’s and Don’ts of Stock Market Volatility2
When you look across the subset of indicators within the manufacturing gauge, you find weakness throughout. Order backlogs are falling, employment growth has been sputtering, and the index of new orders – which is a leading indicator – fell for the 10th straight month (chart below).
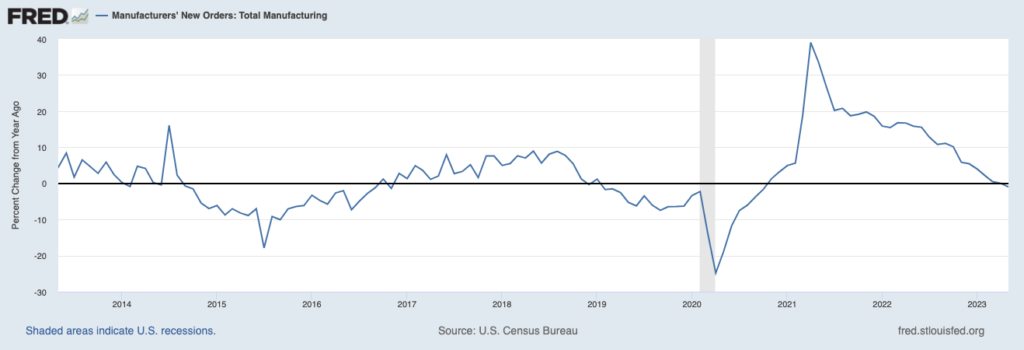
Source: Federal Reserve Bank of St. Louis3
Overall, it’s not great. But there are a few bright spots worth mentioning that also help explain why economic alarm bells are not going off. The first is that an index measuring producer prices, which are the prices paid by manufacturers for inputs, has fallen substantially – a good sign that price pressures could continue abating in the future. Easing price pressures factor as a positive for inflation and interest rates, and also signal improved supply chain conditions.
Another point to make is that new orders are falling from historically high levels (see chart below), so the total output is still relatively strong even as activity is weakening.
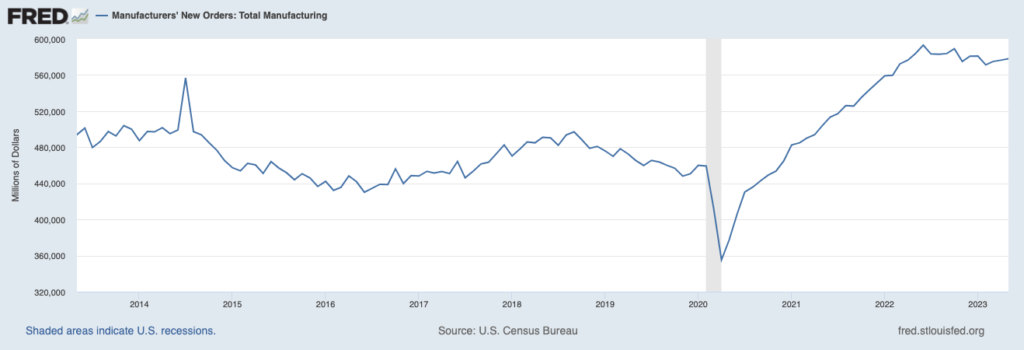
Source: Federal Reserve Bank of St. Louis4
A final point to make is that the manufacturing sector in the U.S., while important, only comprises about 12% of the economy in terms of output. Weak factory activity, in other words, is not likely to sink the economy by itself.
The other side of the ISM ledger is services, which is the crucial driver of U.S. economic activity. There we still see positive momentum – the U.S. services sector remained in expansion mode for the sixth consecutive month, with Services PMI registering at 53.9. Among the strong contributors to services sector activity was the Business Activity Index, which rose 7.7% from May, and the New Orders Index, which increased by 2.6%. Strong services activity and spending are the reasons the U.S. economy continues to expand, which makes it important to view manufacturing weakness in a broader context.
Factors, like the manufacturing sector, can contribute to a volatile market, and it’s important for investors to learn how to navigate through uncertain times like these.
Although it’s impossible to avoid volatility, there are ways you can minimize the worst impacts of a volatile market. In our newest guide, ‘The Do’s and Don’ts of Stock Market Volatility’ we provide recommendations for investors, based on 30 years of expertise. We also explore:
- 3 best practices to successfully manage periods of market volatility
- 3 most common mistakes investors make, and why they are so damaging to your long-term investing goals
- Historical data that supports our conclusions and underscores the recommendations we propose
If you have $500,000 or more to invest, get our free guide today!
Disclosure
2 Zacks Investment Management reserves the right to amend the terms or rescind our free The Do’s and Don’ts of Stock Market Volatility offer at any time and for any reason at its discretion.
3 Fred Economic Data. July 5, 2023. https://fred.stlouisfed.org/series/AMTMNO
4 Fred Economic Data. July 5, 2023. https://fred.stlouisfed.org/series/AMTMNO
5 Zacks Investment Management reserves the right to amend the terms or rescind our free The Do’s and Don’ts of Stock Market Volatility offer at any time and for any reason at its discretion.
DISCLOSURE
Past performance is no guarantee of future results. Inherent in any investment is the potential for loss.
Zacks Investment Management, Inc. is a wholly-owned subsidiary of Zacks Investment Research. Zacks Investment Management is an independent Registered Investment Advisory firm and acts as an investment manager for individuals and institutions. Zacks Investment Research is a provider of earnings data and other financial data to institutions and to individuals.
This material is being provided for informational purposes only and nothing herein constitutes investment, legal, accounting or tax advice, or a recommendation to buy, sell or hold a security. Do not act or rely upon the information and advice given in this publication without seeking the services of competent and professional legal, tax, or accounting counsel. Publication and distribution of this article is not intended to create, and the information contained herein does not constitute, an attorney-client relationship. No recommendation or advice is being given as to whether any investment or strategy is suitable for a particular investor. It should not be assumed that any investments in securities, companies, sectors or markets identified and described were or will be profitable. All information is current as of the date of herein and is subject to change without notice. Any views or opinions expressed may not reflect those of the firm as a whole.
Any projections, targets, or estimates in this report are forward looking statements and are based on the firm’s research, analysis, and assumptions. Due to rapidly changing market conditions and the complexity of investment decisions, supplemental information and other sources may be required to make informed investment decisions based on your individual investment objectives and suitability specifications. All expressions of opinions are subject to change without notice. Clients should seek financial advice regarding the appropriateness of investing in any security or investment strategy discussed in this presentation.
Certain economic and market information contained herein has been obtained from published sources prepared by other parties. Zacks Investment Management does not assume any responsibility for the accuracy or completeness of such information. Further, no third party has assumed responsibility for independently verifying the information contained herein and accordingly no such persons make any representations with respect to the accuracy, completeness or reasonableness of the information provided herein. Unless otherwise indicated, market analysis and conclusions are based upon opinions or assumptions that Zacks Investment Management considers to be reasonable. Any investment inherently involves a high degree of risk, beyond any specific risks discussed herein.
The S&P 500 Index is a well-known, unmanaged index of the prices of 500 large-company common stocks, mainly blue-chip stocks, selected by Standard & Poor’s. The S&P 500 Index assumes reinvestment of dividends but does not reflect advisory fees. The volatility of the benchmark may be materially different from the individual performance obtained by a specific investor. An investor cannot invest directly in an index.