As we enter Q4, it’s the perfect time for investors to reassess their portfolios and explore new strategies. In this week’s Steady Investor, we highlight three key trends that could shape your investment approach moving forward:
- What to look for as bank earnings hit the tape
- China offers more economic support
- Fears of a global oil shock grow as Mideast crisis escalates
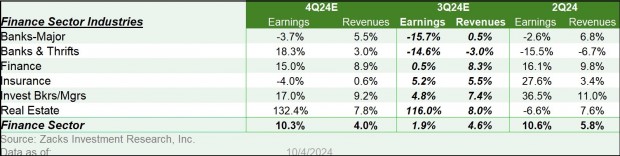
What to Look for as Bank Earnings Hit the Tape – Q3 2024 earnings season is officially underway, with the first major banks reporting results on Friday. Investors will have much to parse. For one, this will be the first earnings reporting in years where interest rates are being actively lowered by the Federal Reserve, which can greatly impact everything from net interest margins, to the value of fixed-rate loans on banks’ balance sheets, to the unrealized losses many banks have on government and mortgage-backed securities purchased when the benchmark Fed funds rate was anchored to the zero bound. According to data from Zacks Investment Research, loan demand has been anemic in recent quarters, with industry data suggesting loan growth of about +1% in Q3. With respect to investment banking, revenues should be up in the low- to mid-teens percentage range, with year-over-year gains in the debt and equity capital markets activities offset by continued weakness on the M&A side. The outlook for M&A should perk up once the election uncertainty is in the rearview mirror and clarity about the political and regulatory environment emerges. All told, the Zacks Major Banks industry is expected to earn -15.7% fewer earnings in 2024 Q3 on +0.5% higher revenues. Zooming out to the Financials sector, however, we find that earnings are expected to be up +1.9% from the same period last year on +4.6% higher revenues.1
The 2024 Presidential Election and Its Effects on Your Investing Portfolio
The election is around the corner, and as challenging as it is to invest in this current economy, it’s still essential to stay focused on sound, objective decisions rather than emotions.
We recommend looking at historical market performance during election years to shape your current investing decisions. Our free guide, Stock Market Returns in an Election Year, shares insights into historical market performance during election years, including:
- How stocks have performed in every election year since 1928
- The effect on performance when an incumbent runs for re-election
- How 2024 has compared to election year averages so far
- And more…
If you have $500,000 or more, fill out the form to get your free copy of this special report today—and invest smarter during this election year!
Get our FREE guide: Stock Market Returns in an Election Year3
China’s Stimulus Measures So Far Fail to Impress Markets – Last month, China caught the market’s attention with surprise announcements for monetary stimulus. Readers may recall that the People’s Bank of China (PBOC) announced it would cut its benchmark interest rate and allow banks to hold less cash in reserves relative to deposit levels, which was designed to free up more capital for lending. Mortgage rates were also cut by 50 basis points, and $70 billion in loans were made available for funds, brokers, and insurers to buy Chinese stocks. Now, on top of these stimulus measures, China’s National Development and Reform Commission announced another round of stimulus. The difference this time, however, was that it disappointed markets. The announcement called for $14 billion in 2025 funds to be pulled forward into this year for fiscal spending with an additional $14 billion for construction projects. This $28 billion outlay pales in comparison to the hundreds of billions of dollars investors were hoping to see, and the disappointment was immediately reflected in equity markets.4
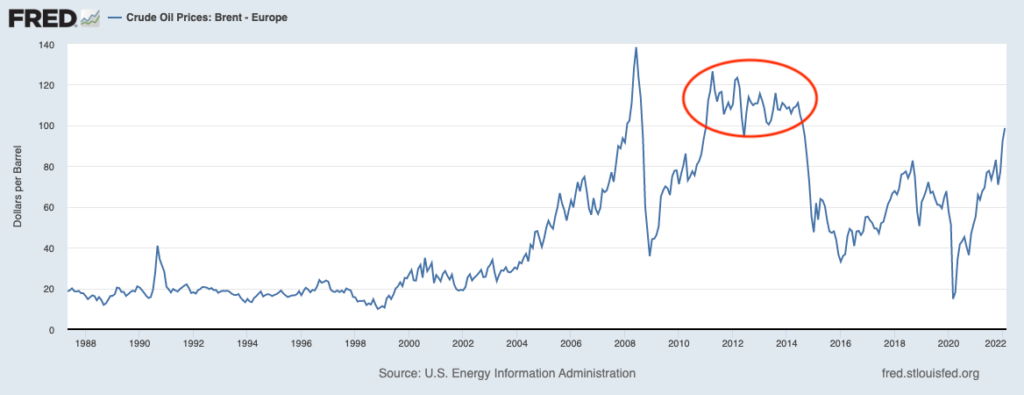
Are Oil Prices Set to Surge as the Crisis in the Middle East Escalates? Investors are growing increasingly concerned that the escalating war in the Middle East is poised to disrupt oil markets and send prices rising.5 In the week ending October 4, for instance, crude oil prices soared 9.1% on concerns that Iran’s oil fields would be targeted. It was the biggest advance for oil prices since March 2023.6 We agree that this is a risk worth watching, especially if Israel targets Iranian oil fields and Iran chooses to retaliate by blockading the Strait of Hormuz, through which roughly 17 million barrels of oil travel every day (roughly 25% of total global consumption). In worst case scenarios, this could indeed send prices skyward which could dent growth and be inflationary at the same time. At the same time, however, conflicts in this region and threats to the Strait of Hormuz are not new, and it is also important to note that Iran produces a little over 3 million barrels per day of oil, which is about 3% of global daily output. In a scenario where this oil production goes offline, other oil producing countries in the region like Saudi Arabia have plenty of spare capacity to make up for any hit to global supply, which they would likely do if prices rise. It’s also worth remembering that oil prices (chart below) remained firmly above $100 a barrel from the beginning of 2011 through the summer of 2014, during which time the U.S. economy grew, and the stock market went up by over +50%. We don’t think oil prices will reach this level, with supply and demand largely in balance at current prices.
Concerned with Your Investments During This Election Year? Investing during an election year requires setting aside political views to focus on objective, well-supported decisions.
To keep your portfolio on track during these turbulent times, we recommend taking a look at market performance from previous election years to guide your decision-making.
Our free guide, Stock Market Returns in an Election Year 8, shares insights into historical market performance during election years, including:
- How stocks have performed in every election year since 1928
- The effect on performance when an incumbent runs for re-election
- How 2024 has compared to election year averages so far
- And more…
If you have $500,000 or more, fill out the form to get your free copy of this special report today—and invest smarter during this election year!
Disclosure
2 Zacks. 2024. https://www.zacks.com/commentary/2346398/are-bank-stocks-a-buy-ahead-of-quarterly-results?
3 ZIM may amend or rescind the guide “Stock Market Returns in an Election Year” for any reason and at ZIM’s discretion.
4 AP News. 2024. https://apnews.com/article/china-economy-monetary-fiscal-stimulus-85d066a30085549200cdff18984c343a
5 NY Times. 2024. https://www.nytimes.com/2024/10/07/business/middle-east-conflict-economic-risks.html
6 Morningstar. 2024. https://www.morningstar.com/news/marketwatch/20241007123/brent-crude-tops-80-a-barrel-on-fears-middle-east-war-will-threaten-supply
7 Fred Economic Data. October 9, 2024. https://fred.stlouisfed.org/series/DCOILBRENTEU
8 ZIM may amend or rescind the guide “Stock Market Returns in an Election Year” for any reason and at ZIM’s discretion.
DISCLOSURE
Past performance is no guarantee of future results. Inherent in any investment is the potential for loss.
Zacks Investment Management, Inc. is a wholly-owned subsidiary of Zacks Investment Research. Zacks Investment Management is an independent Registered Investment Advisory firm and acts as an investment manager for individuals and institutions. Zacks Investment Research is a provider of earnings data and other financial data to institutions and to individuals.
This material is being provided for informational purposes only and nothing herein constitutes investment, legal, accounting or tax advice, or a recommendation to buy, sell or hold a security. Do not act or rely upon the information and advice given in this publication without seeking the services of competent and professional legal, tax, or accounting counsel. Publication and distribution of this article is not intended to create, and the information contained herein does not constitute, an attorney-client relationship. No recommendation or advice is being given as to whether any investment or strategy is suitable for a particular investor. It should not be assumed that any investments in securities, companies, sectors or markets identified and described were or will be profitable. All information is current as of the date of herein and is subject to change without notice. Any views or opinions expressed may not reflect those of the firm as a whole.
Any projections, targets, or estimates in this report are forward looking statements and are based on the firm’s research, analysis, and assumptions. Due to rapidly changing market conditions and the complexity of investment decisions, supplemental information and other sources may be required to make informed investment decisions based on your individual investment objectives and suitability specifications. All expressions of opinions are subject to change without notice. Clients should seek financial advice regarding the appropriateness of investing in any security or investment strategy discussed in this presentation.
Certain economic and market information contained herein has been obtained from published sources prepared by other parties. Zacks Investment Management does not assume any responsibility for the accuracy or completeness of such information. Further, no third party has assumed responsibility for independently verifying the information contained herein and accordingly no such persons make any representations with respect to the accuracy, completeness or reasonableness of the information provided herein. Unless otherwise indicated, market analysis and conclusions are based upon opinions or assumptions that Zacks Investment Management considers to be reasonable.
Any investment inherently involves a high degree of risk, beyond any specific risks discussed herein.
It is not possible to invest directly in an index. Investors pursuing a strategy similar to an index may experience higher or lower returns, which will be reduced by fees and expenses.
The S&P 500 Index is a well-known, unmanaged index of the prices of 500 large-company common stocks, mainly blue-chip stocks, selected by Standard & Poor’s. The S&P 500 Index assumes reinvestment of dividends but does not reflect advisory fees. The volatility of the benchmark may be materially different from the individual performance obtained by a specific investor. An investor cannot invest directly in an index.
The Russell 1000 Growth Index is a well-known, unmanaged index of the prices of 1000 large-company growth common stocks selected by Russell. The Russell 1000 Growth Index assumes reinvestment of dividends but does not reflect advisory fees. An investor cannot invest directly in an index. The volatility of the benchmark may be materially different from the individual performance obtained by a specific investor.
Nasdaq Composite Index is the market capitalization-weighted index of over 3,300 common equities listed on the Nasdaq stock exchange. The types of securities in the index include American depositary receipts, common stocks, real estate investment trusts (REITs) and tracking stocks, as well as limited partnership interests. The index includes all Nasdaq-listed stocks that are not derivatives, preferred shares, funds, exchange-traded funds (ETFs) or debenture securities. An investor cannot invest directly in an index. The volatility of the benchmark may be materially different from the individual performance obtained by a specific investor.
“The Dow Jones Industrial Average measures the daily stock market movements of 30 U.S. publicly-traded companies listed on the NASDAQ or the New York Stock Exchange (NYSE). The 30 publicly-owned companies are considered leaders in the United States economy. An investor cannot directly invest in an index. The volatility of the benchmark may be materially different from the individual performance obtained by a specific investor.”
Returns for each strategy and the corresponding Morningstar Universe reflect the annualized returns for the periods indicated. The Morningstar Universes used for comparative analysis are constructed by Morningstar (median performance) and data is provided to Zacks by Zephyr Style Advisor. The percentile ranking for each Zacks Strategy is based on the gross comparison for Zacks Strategies vs. the indicated universe rounded up to the nearest whole percentile. Other managers included in universe by Morningstar may exhibit style drift when compared to Zacks Investment Management portfolio. Neither Zacks Investment Management nor Zacks Investment Research has any affiliation with Morningstar. Neither Zacks Investment Management nor Zacks Investment Research had any influence of the process Morningstar used to determine this ranking.
The Russell 1000 Value Index is a well-known, unmanaged index of the prices of 1000 large-company value common stocks selected by Russell. The Russell 1000 Value Index assumes reinvestment of dividends but does not reflect advisory fees. An investor cannot directly invest in an index. The volatility of the benchmark may be materially different from the individual performance obtained by a specific investor.