Steep Valuations Have Many Investors Feeling Uneasy
Nearly three decades ago, Federal Reserve Chair Alan Greenspan made one of the most historically memorable comments about market levels, when he wondered if “irrational exuberance” had taken hold. Greenspan ended up being right, but he was three years too early on his market call. An investor who had taken his warning to heart would have missed the outsized gains that characterized the late 1990s.1
Fast forward to today, and similar warnings are once again making the rounds.
The S&P 500 has climbed to fresh record highs this fall, and with it, so has a chorus of concern about valuations. Many are asking whether today’s artificial intelligence–driven rally is another episode of overexuberance, where investors are paying large premiums for the promise of future earnings. It’s a fair question.
The thread I want to pull here is to compare the market’s composition today with how it looked in 1999, when the tech bubble burst. Doing so shows that these two periods are not as alike as many might think.
What the Latest Market Data Means for Q4 Positioning
With markets at record highs and valuation concerns mounting, investors need a clear view of what’s driving performance.
The October Stock Market Outlook Report2 examines earnings strength, sector leadership, and key economic signals to help you assess whether current prices are justified, or vulnerable.
Inside, you’ll find the critical data and analysis investors are using to position for Q4, such as:
- Asset allocation guidelines for today’s market environment
- Expert forecasts for inflation, rates, and economic trends
- Industry tables and rankings to help you spot opportunities
- Buy-side and sell-side consensus insights at a glance
- And much more!
If you have $500,000 or more to invest, claim your free copy of the report and see how today’s policy shifts could shape tomorrow’s opportunities.
IT’S FREE. Download our latest October Stock Market Outlook Report3
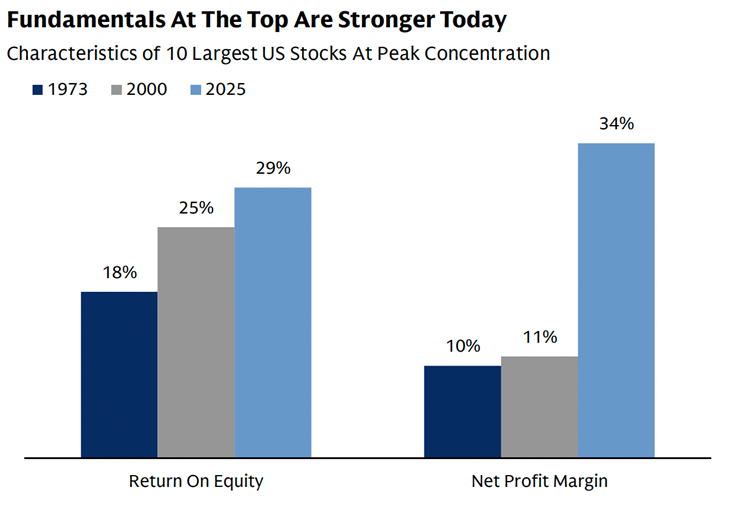
Today, the largest U.S. companies are highly profitable, cash-rich, and deeply integrated into the global economy. They are not the speculative start-ups of 1999. As the chart below shows, the ten largest U.S. companies (nearly all Tech companies) now operate with an average return on equity of 29% and net profit margins of 34% (blue bars), both materially stronger than the levels seen during prior episodes of peak market concentration, and notably better than in 2000 when the tech bubble burst (gray bars).
Market concentration is a different concern, as today’s biggest companies account for a larger share of the S&P 500 than the “tech darlings” of the late 1990s ever did. Crucially, however, today’s weightings are supported by earnings power. The “Magnificent Seven” have an average forward P/E of 26.8x and a forward Enterprise Value (EV)/sales multiple of 6.1x. Compare that to 52x forward earnings and an 8.2x EV/sales ratio for the biggest Technology companies in 2000.
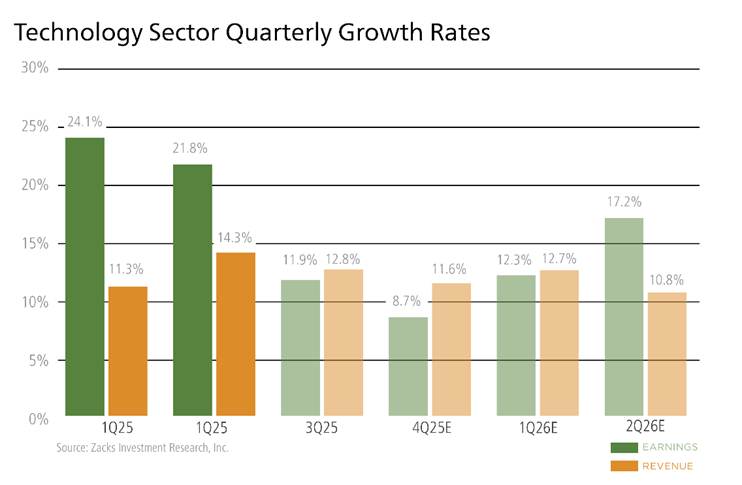
In short, valuations today may be elevated in absolute terms, but they’re far more grounded in cash flow, scale, and real economic contribution than they were in the past. Tech earnings, as shown in the chart below, underscore this point. Excluding the Tech sector contribution, Zacks estimates that Q3 earnings for the rest of the S&P 500 index would be up only +2.7% (vs. +5.5% otherwise).
Earnings elsewhere in the market are also being revised higher, in a sign of optimism among business executives. But I want to be clear that should earnings weaken, perhaps due to slower global growth, rising costs, or a pullback in capital spending, lofty valuations could magnify downside moves. Investors should keep a close eye on corporate profits and margins, because those will determine whether valuations stay “fair” or become stretched. These fundamentals are great now, but that could change.
Bottom Line for Investors
High valuations often attract attention, but they rarely offer useful forecasts. Consider the various forms of price-to-earnings ratios—trailing, forward, and cyclically adjusted (CAPE). Each tries to gauge how expensive the market is, yet none has proven reliable in signaling future returns.
Trailing P/Es rely on past profits that markets already absorbed months ago. Forward P/Es rely on estimates, some better than others. And CAPE, while theoretically designed to smooth earnings over time, has been above its “long-term average” for most of the last 15 years, during which stocks have produced some of their strongest returns in history.
From my vantage, valuations today are high, but they’re not irrational given the supporting structure of strong earnings growth. They reflect a market underpinned by solid balance sheets and durable business models. Could that change if profits falter? Absolutely, and that’s worth monitoring.
Markets may be at record highs, but the real insight lies beneath the surface in profit trends, margin pressure, and revisions that shape future returns. Staying informed means focusing on data rather than distractions.
The October Stock Market Outlook5 breaks down the numbers guiding institutional decisions going into Q4. Inside, you’ll find:
- Asset allocation guidelines for today’s market environment
- Expert forecasts for inflation, rates, and economic trends
- Industry tables and rankings to help you spot opportunities
- Buy-side and sell-side consensus insights at a glance
- And much more!
Download your copy to cut through political noise and see the fundamentals shaping the market’s next move.
Disclosure
2 Zacks Investment Management reserves the right to amend the terms or rescind the free-Stock Market Outlook Report offer at any time and for any reason at its discretion.
3 Goldman Sachs. 2025.
4 Zacks.com. October 3, 2025. https://www.zacks.com/commentary/2761906/a-closer-look-at-the-evolving-earnings-picture
5 Zacks Investment Management reserves the right to amend the terms or rescind the free-Stock Market Outlook Report offer at any time and for any reason at its discretion.
DISCLOSURE
Past performance is no guarantee of future results. Inherent in any investment is the potential for loss.
Zacks Investment Management, Inc. is a wholly-owned subsidiary of Zacks Investment Research. Zacks Investment Management is an independent Registered Investment Advisory firm and acts as an investment manager for individuals and institutions. Zacks Investment Research is a provider of earnings data and other financial data to institutions and to individuals.
This material is being provided for informational purposes only and nothing herein constitutes investment, legal, accounting or tax advice, or a recommendation to buy, sell or hold a security. Do not act or rely upon the information and advice given in this publication without seeking the services of competent and professional legal, tax, or accounting counsel. Publication and distribution of this article is not intended to create, and the information contained herein does not constitute, an attorney-client relationship. No recommendation or advice is being given as to whether any investment or strategy is suitable for a particular investor. It should not be assumed that any investments in securities, companies, sectors or markets identified and described were or will be profitable. All information is current as of the date of herein and is subject to change without notice. Any views or opinions expressed may not reflect those of the firm as a whole.
Any projections, targets, or estimates in this report are forward looking statements and are based on the firm’s research, analysis, and assumptions. Due to rapidly changing market conditions and the complexity of investment decisions, supplemental information and other sources may be required to make informed investment decisions based on your individual investment objectives and suitability specifications. All expressions of opinions are subject to change without notice. Clients should seek financial advice regarding the appropriateness of investing in any security or investment strategy discussed in this presentation.
Certain economic and market information contained herein has been obtained from published sources prepared by other parties. Zacks Investment Management does not assume any responsibility for the accuracy or completeness of such information. Further, no third party has assumed responsibility for independently verifying the information contained herein and accordingly no such persons make any representations with respect to the accuracy, completeness or reasonableness of the information provided herein. Unless otherwise indicated, market analysis and conclusions are based upon opinions or assumptions that Zacks Investment Management considers to be reasonable. Any investment inherently involves a high degree of risk, beyond any specific risks discussed herein.
The S&P 500 Index is a well-known, unmanaged index of the prices of 500 large-company common stocks, mainly blue-chip stocks, selected by Standard & Poor’s. The S&P 500 Index assumes reinvestment of dividends but does not reflect advisory fees. The volatility of the benchmark may be materially different from the individual performance obtained by a specific investor. An investor cannot invest directly in an index.