The “K-Shaped” U.S. Consumer Landscape
In looking closely at the U.S. consumer, I see 2025 shaping up to resemble the “K-shaped” pattern we saw earlier in the decade. The “K” refers to higher-income households continuing to spend comfortably, while lower- and middle-income consumers show more strain and even pull back from certain categories of purchases.
This divergence matters for investors, but not because it signals an imminent recession. Instead, it helps explain the mix of economic data we’re seeing at a time when broad sentiment continues to sink.1
Recent shutdown-delayed data showed retail sales slowing toward the end of the third quarter, rising just 0.2% in September. Categories tied closely to tariffs, such as vehicles, electronics, and clothing, all showed noticeable pullbacks. But there were also bright spots, with service-oriented spending, particularly in restaurants and personal care, remaining firm. This data reinforces the argument that we’re in a “K-shaped” consumer environment, where different income groups are spending in different directions.
The Consumer Is Splitting. Here’s What It Means for Markets
The newest data shows a clear K-shaped pattern: higher-income households are still spending, while lower- and middle-income consumers are pulling back. Sentiment is dropping fast, but markets are reacting in uneven ways.
Our November Stock Market Outlook Report2 explains how this divergence is shaping sector performance, recession odds, and where resilience is emerging. Inside, you’ll find:
- Asset allocation guidelines for today’s market environment
- Expert forecasts for inflation, rates, and economic trends
- Industry tables and rankings to help you spot opportunities
- Buy-side and sell-side consensus insights at a glance
- And much more!
If you have $500,000 or more to invest, claim your complimentary copy of the report and see how shifting market trends could influence opportunities in the months ahead.
IT’S FREE. Download our latest November Stock Market Outlook Report2
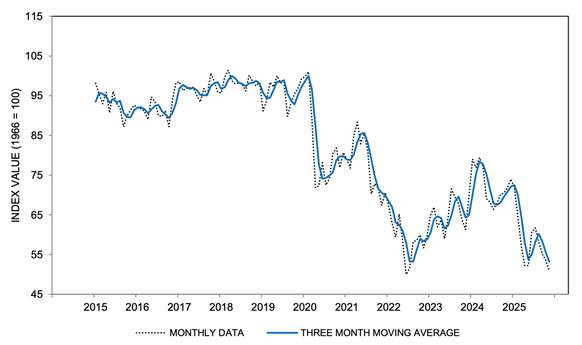
On the sentiment side, the Conference Board’s confidence reading dropped sharply in November to 88.7 from 95.5, and the University of Michigan’s survey fell to 51 (see chart below). That’s one of the lowest readings for consumer sentiment on record. In that same survey, 44% of middle-income households said their financial situation was worse than a year ago, compared with just 23% who said it had improved. U.S. households have been weary of higher prices for years, but we might be starting to see a wider group ‘throwing in the towel’, especially those who expected prices to reverse under the new administration.
University of Michigan Index of Consumer Sentiment
Lower- and middle-income households have been the most affected by higher living costs, depleted savings, and a cooling labor market. The ADP reported that private employers shed an average of 13,500 jobs per week in the four weeks ending November 8. That sort of softening understandably weighs on sentiment.
But the other side of the “K-shaped” ledger shows higher-income households continuing to show much more resilience. Spending in discretionary service categories rose 0.7% in September, and wealth effects remain meaningful. Household net worth has surged in recent quarters, rising at nearly a 15% annualized rate, which has acted as an important counterweight to softer job creation. Even with frustrations about inflation, this level of wealth growth historically supports consumer spending for some time.
The divide is showing up clearly in behavior.
Many households at the lower and middle end of the income spectrum are trading down, hunting for value, and cutting discretionary purchases. Some surveys show the middle class reporting near-decade lows in financial comfort, despite relatively stable employment. Meanwhile, the upper-tier consumer, who accounts for a disproportionately large share of overall U.S. consumption, has continued to spend. On balance, it’s been enough to keep the broader economy moving forward.
This brings up an important acknowledgment investors should make, and also be watching closely: consumer sentiment has become sensitive to market swings. The S&P 500’s roughly 5% pullback from late October highs coincided with a noticeable dip in upper-income sentiment surveys. But when markets strengthen, confidence tends to rise as well.
Taken together, these dynamics matter for investors because they help explain why consumer data can appear mixed without signaling recession. A softening labor market, persistent inflation pressures, and fading confidence among lower earners are all legitimate concerns. But as long as employment continues to grow modestly, wealth effects remain supportive, and higher-income households continue to spend, the overall expansion can persist, even if it feels uneven on the ground.
Bottom Line for Investors
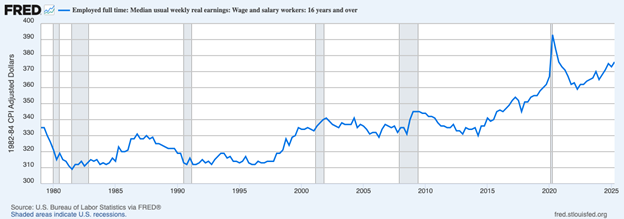
A “K-shaped” U.S. consumer environment is not synonymous with a weakening economy. Many consumers are feeling pressure, but it’s also true that we’re still seeing upward movement in real wages (see chart below). I take this to mean that consumers broadly are feeling frustrated, but they’re not retrenching.
That said, the expansion is increasingly reliant on those with the healthiest balance sheets. Higher-income households continue to spend because equity gains, rising home values, and strong net-worth growth give them the capacity to do so. This helps offset softness elsewhere and has been a stabilizing force.
But it also highlights a key vulnerability. When spending becomes concentrated at the top, the economy becomes more sensitive to anything that chips away at wealth effects. A deeper equity-market pullback, a cooling in housing, or an AI-related shift in white-collar labor demand could have an outsized impact on the very group carrying overall consumption.
For now, the expansion appears durable, supported by ongoing job creation, real wage gains, and strong household balance sheets at the upper end. But the reliance on those dynamics is exactly why investors should stay attuned to them. Because if they begin to turn, the broader economy may feel it more quickly than usual.
With the economy leaning so heavily on top-tier spending, any shift at the upper end can move markets fast. Our November 2025 Stock Market Outlook Report5 shows the signals to watch, and where the next leaders may emerge as the consumer split widens.
Inside, you’ll discover:
- Asset allocation guidelines for today’s market environment
- Expert forecasts for inflation, rates, and economic trends
- Industry tables and rankings to help you spot opportunities
- Buy-side and sell-side consensus insights at a glance
- And much more!
If you have $500,000 or more to invest, claim your complimentary copy of the report and discover how shifting market trends could shape new opportunities in the months ahead.
IT’S FREE. Download our latest November Stock Market Outlook Report5
Disclosure
2 Zacks Investment Management reserves the right to amend the terms or rescind the free-Stock Market Outlook Report offer at any time and for any reason at its discretion.
3 University of Michigan. 2025.
4 Fred Economic Data. July 22, 2025. https://fred.stlouisfed.org/series/LES1252881600Q
5 Zacks Investment Management reserves the right to amend the terms or rescind the free-Stock Market Outlook Report offer at any time and for any reason at its discretion.
DISCLOSURE
Past performance is no guarantee of future results. Inherent in any investment is the potential for loss.
Zacks Investment Management, Inc. is a wholly-owned subsidiary of Zacks Investment Research. Zacks Investment Management is an independent Registered Investment Advisory firm and acts as an investment manager for individuals and institutions. Zacks Investment Research is a provider of earnings data and other financial data to institutions and to individuals.
This material is being provided for informational purposes only and nothing herein constitutes investment, legal, accounting or tax advice, or a recommendation to buy, sell or hold a security. Do not act or rely upon the information and advice given in this publication without seeking the services of competent and professional legal, tax, or accounting counsel. Publication and distribution of this article is not intended to create, and the information contained herein does not constitute, an attorney-client relationship. No recommendation or advice is being given as to whether any investment or strategy is suitable for a particular investor. It should not be assumed that any investments in securities, companies, sectors or markets identified and described were or will be profitable. All information is current as of the date of herein and is subject to change without notice. Any views or opinions expressed may not reflect those of the firm as a whole.
Any projections, targets, or estimates in this report are forward looking statements and are based on the firm’s research, analysis, and assumptions. Due to rapidly changing market conditions and the complexity of investment decisions, supplemental information and other sources may be required to make informed investment decisions based on your individual investment objectives and suitability specifications. All expressions of opinions are subject to change without notice. Clients should seek financial advice regarding the appropriateness of investing in any security or investment strategy discussed in this presentation.
Certain economic and market information contained herein has been obtained from published sources prepared by other parties. Zacks Investment Management does not assume any responsibility for the accuracy or completeness of such information. Further, no third party has assumed responsibility for independently verifying the information contained herein and accordingly no such persons make any representations with respect to the accuracy, completeness or reasonableness of the information provided herein. Unless otherwise indicated, market analysis and conclusions are based upon opinions or assumptions that Zacks Investment Management considers to be reasonable. Any investment inherently involves a high degree of risk, beyond any specific risks discussed herein.
The S&P 500 Index is a well-known, unmanaged index of the prices of 500 large-company common stocks, mainly blue-chip stocks, selected by Standard & Poor’s. The S&P 500 Index assumes reinvestment of dividends but does not reflect advisory fees. The volatility of the benchmark may be materially different from the individual performance obtained by a specific investor. An investor cannot invest directly in an index.