Markets remain resilient as the economic outlook continues to evolve. In this issue of Steady Investor, we cover the key trends investors are watching, including:
- AI’s current impact on inflation
- Gold defies inflation expectations
- Trade holds up despite risks
Is AI Helping or Hurting Inflation? With a ceasefire in place between the U.S. and Iran, energy’s contribution to inflation pressure is expected to ease. But there may be another catalyst in the wings that is more secular in nature: America’s enormous AI build-out, the scale of which is difficult to fathom. Analysts estimate capital spending this year at five hyper-scalers (Alphabet, Amazon, Meta, Microsoft, and Oracle) will reach $741 billion, up nearly 75% from last year. Companies have already announced some $1.5 trillion in data-center plans, with only a small portion of that investment in place so far.The inflation piece that’s interesting here is the reminder that the AI boom is not just about software. It is a physical build-out requiring chips, servers, cooling systems, cables, backup power, and specialized construction labor. When that much money chases limited supply, prices rise. Case in point: in May, consumer prices for software and accessories were up about 15% from a year earlier, while wholesale prices for electronic components and accessories rose about 27%.The cost pressures are not limited to tech hardware. Wages for electrical and wiring-installation contractors were up 6.5% from a year earlier, versus 3.6% for all private-sector workers. Data centers are also expected to account for nearly half of U.S. growth in power demand through 2030, adding another source of upward pressure on electricity costs.AI may eventually boost productivity and lower inflation. But for now, it looks more likely to keep inflation firmer than many investors hoped.1
Markets Have Held Up. Will Your Strategy?
Every week brings a new headline, prediction, or market narrative. The challenge isn’t keeping up with every development; it’s knowing which ones actually matter to your long-term investment strategy.
I recommend downloading our free guide, Navigating Market Volatility3, which provides practical principles to help you filter out distractions, manage risk, and invest with greater confidence. You’ll get insight into:
- Sharp market declines and corrections are a normal part of investing
- The best market days come unexpectedly (often within days or weeks of the worst days)
- Trying to pick market tops and bottoms is nearly impossible
- Trust your strategy and discipline, not the headlines
- Plus, more insights and assistance to help you keep your investment strategy on course
If you have $500,000 or more to invest, get your free volatility guide today!
Download Your Free Copy Today: Navigating Market Volatility: 4 Principles for Staying the Course2
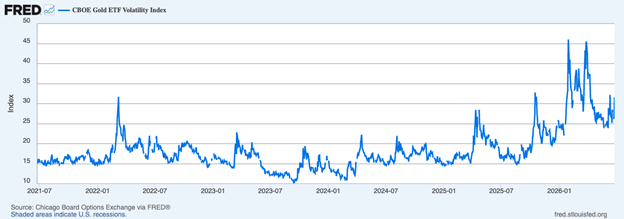
Gold’s Recent Declines Offer a Good Reminder: It Isn’t a Reliable Inflation Hedge – Considering the inflation story above and recent hot readings tied to energy, one might expect gold to be holding up, given its mythical status as a reliable inflation hedge. Only it hasn’t. Gold’s recent slide is a useful reminder that the metal does not move in any simple, reliable lockstep with inflation or uncertainty. Indeed, inflation is still elevated, with May PCE running at 4.1% year over year. 2026 has also hardly lacked for geopolitical stress. Yet gold still fell below $4,000 an ounce this week for the first time since November, after hitting a record near $5,595 in January. That leaves bullion down roughly 29% from its peak despite exactly the sort of backdrop many people assume should favor it. In our view, the point is not that gold never rises during inflationary or uncertain periods. It is that those relationships are inconsistent and far less dependable than gold’s reputation suggests. In the short run, bullion tends to be driven by a messy mix of interest-rate expectations, dollar strength, investor sentiment, and positioning. This time, a hawkish Fed and stronger dollar appear to have mattered more than inflation fears. That helps explain why gold can disappoint investors who treat it as a straightforward hedge. It is still a commodity, and commodities can be volatile and sentiment driven.3
CBOE Gold Volatility Index
Despite All the Tariff and Geopolitical Noise, Trade Continues Apace – A little over a year on from “Liberation Day,” and we are pleased to report that fears of a global reordering of trade were overblown. World trade flows rose in April, with the volume of goods moving across borders up 0.7% from March after a 2.3% decline the prior month. That may not sound dramatic, but it is another sign that global trade has remained surprisingly resilient despite tariffs, shipping disruptions, softer business confidence, and lingering fallout from the conflict in the Middle East.Part of that resilience appears to reflect businesses building inventories to get ahead of possible supply disruptions and higher costs. But a more durable support has been the continued boom in AI-related investment, which is helping drive trade in semiconductors, servers, and other electronic equipment.All told, world trade increased 4.2% in 2025 despite widespread expectations that tariffs and geopolitical tensions would drag more heavily on cross-border activity. The strength appears to have carried into this year as well, even with periodic setbacks.For investors, that is the key takeaway. Trade is not booming in a straight line, and conflict-related disruptions are still a real risk, especially for commodity flows. But the global system has so far proven more adaptable than many feared. AI-related demand, improved trade policy conditions, and businesses’ ability to reroute or rebuild inventories have all helped cushion the blow.5
How Should Investors Respond to Today’s Market Environment? – Navigating today’s market environment isn’t about predicting what’s next; it’s about having a disciplined approach that can adapt to changing conditions while keeping your long-term goals in focus.
Our exclusive guide, Navigating Market Volatility6 is a free guide that offers a clear framework for staying disciplined and managing risk during uncertain markets. It covers topics such as:
- Sharp market declines and corrections are a normal part of investing
- The best market days come unexpectedly (often within days or weeks of the worst days)
- Trying to pick market tops and bottoms is nearly impossible
- Trust your strategy and discipline, not the headlines
- Plus, more insights and assistance to help you keep your investment strategy on course
If you have $500,000 or more to invest, access your free volatility guide today.
Disclosure
2 Zacks Investment Management reserves the right to amend the terms or rescind the free Navigating Market Volatility: 4 Principles for Staying the Course offer at any time and for any reason at its discretion.
3 Financial Advisor. June 24, 2026. https://www.fa-mag.com/news/gold-breaks-below--4-000-as-multi-year-rally-grinds-to-a-halt-87514.html
4 Fred Economic Data. June 26, 2026. https://fred.stlouisfed.org/series/GVZCLS
5 Wall Street Journal. June 25, 2026. https://www.wsj.com/economy/trade/world-trade-rose-in-april-in-fresh-sign-of-resilience-7765597b?mod=economy_feat1_global_pos1
6 Zacks Investment Management reserves the right to amend the terms or rescind the free Navigating Market Volatility: 4 Principles for Staying the Course offer at any time and for any reason at its discretion.
DISCLOSURE
Past performance is no guarantee of future results. Inherent in any investment is the potential for loss.
Zacks Investment Management, Inc. is a wholly-owned subsidiary of Zacks Investment Research. Zacks Investment Management is an independent Registered Investment Advisory firm and acts as an investment manager for individuals and institutions. Zacks Investment Research is a provider of earnings data and other financial data to institutions and to individuals.
This material is being provided for informational purposes only and nothing herein constitutes investment, legal, accounting or tax advice, or a recommendation to buy, sell or hold a security. Do not act or rely upon the information and advice given in this publication without seeking the services of competent and professional legal, tax, or accounting counsel. Publication and distribution of this article is not intended to create, and the information contained herein does not constitute, an attorney-client relationship. No recommendation or advice is being given as to whether any investment or strategy is suitable for a particular investor. It should not be assumed that any investments in securities, companies, sectors or markets identified and described were or will be profitable. All information is current as of the date of herein and is subject to change without notice. Any views or opinions expressed may not reflect those of the firm as a whole.
Any projections, targets, or estimates in this report are forward looking statements and are based on the firm’s research, analysis, and assumptions. Due to rapidly changing market conditions and the complexity of investment decisions, supplemental information and other sources may be required to make informed investment decisions based on your individual investment objectives and suitability specifications. All expressions of opinions are subject to change without notice. Clients should seek financial advice regarding the appropriateness of investing in any security or investment strategy discussed in this presentation.
Certain economic and market information contained herein has been obtained from published sources prepared by other parties. Zacks Investment Management does not assume any responsibility for the accuracy or completeness of such information. Further, no third party has assumed responsibility for independently verifying the information contained herein and accordingly no such persons make any representations with respect to the accuracy, completeness or reasonableness of the information provided herein. Unless otherwise indicated, market analysis and conclusions are based upon opinions or assumptions that Zacks Investment Management considers to be reasonable. Any investment inherently involves a high degree of risk, beyond any specific risks discussed herein.
It is not possible to invest directly in an index. Investors pursuing a strategy similar to an index may experience higher or lower returns, which will be reduced by fees and expenses.
The S&P 500 Index is a well-known, unmanaged index of the prices of 500 large-company common stocks, mainly blue-chip stocks, selected by Standard & Poor’s. The S&P 500 Index assumes reinvestment of dividends but does not reflect advisory fees. The volatility of the benchmark may be materially different from the individual performance obtained by a specific investor. An investor cannot invest directly in an index.
The Russell 1000 Growth Index is a well-known, unmanaged index of the prices of 1000 large-company growth common stocks selected by Russell. The Russell 1000 Growth Index assumes reinvestment of dividends but does not reflect advisory fees. An investor cannot invest directly in an index. The volatility of the benchmark may be materially different from the individual performance obtained by a specific investor.
Nasdaq Composite Index is the market capitalization-weighted index of over 3,300 common equities listed on the Nasdaq stock exchange. The types of securities in the index include American depositary receipts, common stocks, real estate investment trusts (REITs) and tracking stocks, as well as limited partnership interests. The index includes all Nasdaq-listed stocks that are not derivatives, preferred shares, funds, exchange-traded funds (ETFs) or debenture securities. An investor cannot invest directly in an index. The volatility of the benchmark may be materially different from the individual performance obtained by a specific investor.
“The Dow Jones Industrial Average measures the daily stock market movements of 30 U.S. publicly-traded companies listed on the NASDAQ or the New York Stock Exchange (NYSE). The 30 publicly-owned companies are considered leaders in the United States economy. An investor cannot directly invest in an index. The volatility of the benchmark may be materially different from the individual performance obtained by a specific investor.”
Returns for each strategy and the corresponding Morningstar Universe reflect the annualized returns for the periods indicated. The Morningstar Universes used for comparative analysis are constructed by Morningstar (median performance) and data is provided to Zacks by Zephyr Style Advisor. The percentile ranking for each Zacks Strategy is based on the gross comparison for Zacks Strategies vs. the indicated universe rounded up to the nearest whole percentile. Other managers included in universe by Morningstar may exhibit style drift when compared to Zacks Investment Management portfolio. Neither Zacks Investment Management nor Zacks Investment Research has any affiliation with Morningstar. Neither Zacks Investment Management nor Zacks Investment Research had any influence of the process Morningstar used to determine this ranking.