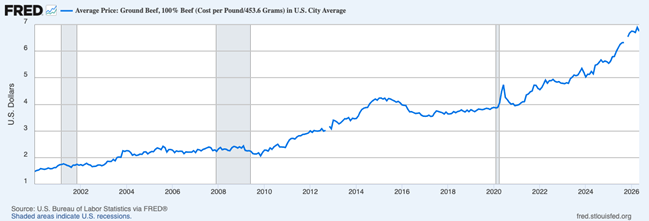
Your Fourth of July Grill Out May Be Pricier This Year – Beef remains a Fourth of July staple, but this year’s cookout may cost a little more. Ground beef prices were up 13% through May, while ground beef and steak cuts were both about 14% higher than a year ago, according to Wells Fargo’s Agri-Food Institute.1 The reason is mostly supply. Drought conditions, higher feed and labor costs, and years of herd reductions have left the U.S. cattle herd at its smallest level since 1951. Rebuilding herds takes time, since calves need roughly two to three years to reach the market. As such, that means tighter beef supply may remain part of the food-price picture for a while. Even still, higher beef prices don’t need to dampen the holiday. Wells Fargo estimates the average barbecue for 10 people will cost about $161 this year, or roughly $16 per person. Chicken, hot dogs, pork shoulder, and ribs are rising more slowly than beef, giving shoppers plenty of ways to keep the grill full without relying only on burgers and steaks. For investors, the story is also a reminder that inflation is not always broad-based. Sometimes it comes from very specific supply constraints. For families, the takeaway is simpler: celebrate the holiday, enjoy the grill, and shop strategically.
Worried Today’s Inflation Will Create a Gap in Your Retirement Income?
Markets have weathered inflation before—but this kind of inflation can take years to unwind, and the effects on retirement income are worth planning around. Our free guide, How Solid Is Your Retirement Strategy?, looks at exactly this kind of long-term risk and what you can do about it.
To stay prepared, download our free guide to learn:
- The importance of flexible portfolio allocation
- Why keeping some liquid assets can potentially help you preserve more wealth
- Understanding your risk tolerance in case of a market downturn
- Plus, more strategies to help you protect your retirement assets
If retirement planning is a priority for you, download your free guide to long-term retirement risk using the link below.
Download How Solid Is Your Retirement Strategy?3
A World Cup Boost for the Job Market? – For soccer fans out there, it may be nice to know that the June jobs report may get a small lift from the World Cup. Goldman Sachs estimates the tournament could add roughly 40,000 jobs to payroll growth, with the impact most likely concentrated in leisure and hospitality, professional and business services, trade, and transportation.4 Private payroll data from ADP, which has already been released for June, showed 98,000 new jobs added, with nearly half the growth coming from education and health services. What we continue to see, in our view, is not a booming or a busting labor market, which is consistent with our forecast for modest but positive GDP growth in 2025. From an investment perspective, remember that jobs data are important but also backward-looking. Markets tend to care more about where growth, earnings, and policy are headed.
Celebrating America’s Birthday with Strong Stock Returns – U.S. stocks closed out a strong quarter, with the S&P 500 and Nasdaq posting their best quarterly performances since 2020. Perhaps unsurprisingly, the rally was led by the Technology sector, with semiconductors having an especially strong showing.5 The PHLX Semiconductor Index climbed 88% for the quarter, its best quarter on record, as investors continued to price in strong demand for the hardware, data centers, and components needed to support AI. In keeping with July 4 sentiment, Q2 2026 offered a timely reminder of the U.S. economy’s ability to adapt, invest, and create new engines of growth. Looking ahead, investors are still watching inflation, interest rates, the Middle East, currency volatility, and the consumer. But as has been proven out especially this year, markets do not require perfect conditions to advance.
Your Portfolio Likely Gained Ground This Quarter. Is Your Strategy Built to Last Beyond It?
Strong market performance can make it easy to overlook what’s still building underneath – including the kind of inflation that affects retirement income gradually, not all at once. Our free guide, How Solid Is Your Retirement Strategy?6, can help you assess whether your strategy is positioned to weather what comes next.
To help you assess where your strategy stands, our guide covers:
- The importance of flexible portfolio allocation
- Why keeping some liquid assets can potentially help you preserve more wealth
- Understanding your risk tolerance in case of a market downturn
- Plus, more strategies to help you protect your retirement assets
If a strong quarter has you thinking about what comes next, How Solid Is Your Retirement Strategy?6 is a good place to start.
Disclosure
2 FRED. June 10, 2026. https://fred.stlouisfed.org/series/APU0000703112#
3 ZIM may amend or rescind the guide “How Solid Is Your Retirement Strategy?” for any reason and at ZIM’s discretion.
4 CNBC. July 1, 2026. https://www.cnbc.com/2026/07/01/world-cup-could-boost-the-june-jobs-report-by-40000-goldman-estimates.html
5 WSJ. June 30, 2026. https://www.wsj.com/finance/stocks/u-s-stocks-rise-to-cap-best-quarter-in-years-5f5ade0f
6 ZIM may amend or rescind the guide “How Solid Is Your Retirement Strategy?” for any reason and at ZIM’s discretion.
DISCLOSURE
Past performance is no guarantee of future results. Inherent in any investment is the potential for loss.
Zacks Investment Management, Inc. is a wholly-owned subsidiary of Zacks Investment Research. Zacks Investment Management is an independent Registered Investment Advisory firm and acts as an investment manager for individuals and institutions. Zacks Investment Research is a provider of earnings data and other financial data to institutions and to individuals.
This material is being provided for informational purposes only and nothing herein constitutes investment, legal, accounting or tax advice, or a recommendation to buy, sell or hold a security. Do not act or rely upon the information and advice given in this publication without seeking the services of competent and professional legal, tax, or accounting counsel. Publication and distribution of this article is not intended to create, and the information contained herein does not constitute, an attorney-client relationship. No recommendation or advice is being given as to whether any investment or strategy is suitable for a particular investor. It should not be assumed that any investments in securities, companies, sectors or markets identified and described were or will be profitable. All information is current as of the date of herein and is subject to change without notice. Any views or opinions expressed may not reflect those of the firm as a whole.
Any projections, targets, or estimates in this report are forward looking statements and are based on the firm’s research, analysis, and assumptions. Due to rapidly changing market conditions and the complexity of investment decisions, supplemental information and other sources may be required to make informed investment decisions based on your individual investment objectives and suitability specifications. All expressions of opinions are subject to change without notice. Clients should seek financial advice regarding the appropriateness of investing in any security or investment strategy discussed in this presentation.
Certain economic and market information contained herein has been obtained from published sources prepared by other parties. Zacks Investment Management does not assume any responsibility for the accuracy or completeness of such information. Further, no third party has assumed responsibility for independently verifying the information contained herein and accordingly no such persons make any representations with respect to the accuracy, completeness or reasonableness of the information provided herein. Unless otherwise indicated, market analysis and conclusions are based upon opinions or assumptions that Zacks Investment Management considers to be reasonable.
The S&P 500 Index is a well-known, unmanaged index of the prices of 500 large-company common stocks, mainly blue-chip stocks, selected by Standard & Poor’s. The S&P 500 Index assumes reinvestment of dividends but does not reflect advisory fees. The volatility of the benchmark may be materially different from the individual performance obtained by a specific investor. An investor cannot invest directly in an index.
The Nasdaq Composite Index measures all Nasdaq domestic and international based common type stocks listed on The Nasdaq Stock Market. To be eligible for inclusion in the Index, the security's U.S. listing must be exclusively on The Nasdaq Stock Market (unless the security was dually listed on another U.S. market prior to January 1, 2004 and has continuously maintained such listing). The security types eligible for the Index include common stocks, ordinary shares, ADRs, shares of beneficial interest or limited partnership interests and tracking stocks. Security types not included in the Index are closed-end funds, convertible debentures, exchange traded funds, preferred stocks, rights, warrants, units and other derivative securities. An investor cannot invest directly in an index.
The PHLX Semiconductor Sector Index is designed to track the performance of a set of companies engaged in the design, distribution, manufacture, and sale of semiconductors. An investor cannot invest directly in an index. The volatility of the benchmark may be materially different from the individual performance obtained by a specific investor.
Questions posed are for demonstrative and informational purposes only and may not reflect the views of current clients or any one individual.
Any investment inherently involves a high degree of risk, beyond any specific risks discussed herein.