The first quarter of the new year was an encouraging one for equity investors. Stocks rallied strongly, and the media buzz over trade wars and recessions slowly faded into the background. The S&P 500 soared +13.6% in the first three months led by Technology stocks, which rose +19.9%.
In order for investors to participate in this strong performance, however, it meant being invested in stocks at the turn of the year – which would have likely meant participating in the steep and sharp correction in Q4 2018.
In my view, successful investing over time often means taking the good with the bad – enduring difficult patches with the knowledge that brighter days aren’t far ahead. This type of investor mindset comes with experience, but it also helps to take a step back from time to time to take in ‘lessons’ that can help us recognize patterns in the markets. Doing so often helps us make smarter decisions, keep our focus on the long term, and make fewer mistakes over time.
What is In Store for the Remainder of 2019? – Find Out in Our Stock Market Outlook Report
It’s free but also time-sensitive, so you are
encouraged to download Zacks’ Stock Market Outlook Report right now.
This 22-page report is packed with some of our key forecasts and facts to consider as you look at the remainder of Q2 and the rest of 2019:
- For how long will 2019 stay bullish?
- Zacks global markets’ outlook
- What sectors show the best opportunity?
- What industries within those sectors most merit your attention?
- Forecast for the S&P
- Small-cap vs. large-cap returns
- And much more.
If you have $500,000 or more to invest and want to learn more about these forecasts, click on the link below to get your free report today!
IT’S FREE. Download the May 2019 Stock Market Outlook Now1 >>
Here are three lessons I took away from Q1.
Lesson #1: “V-Shaped” Bounces are Real!
By the numbers:
I point out the technology sector’s performance because it offers a good case study in another lesson – that, often, what gets hit the hardest on the way down often bounces back the strongest on the way back up.
The S&P 500 hit its high-water mark in 2018 on September 20, at the 2,930 level. From there, equity investors endured steep declines all the way through to December 24, when the S&P 500 bottomed out at 2,351. That’s a nearly 20% price decline over the course of three months and one week, for readers keeping score.3
But taking a look at the chart below, it becomes clear that the market followed a “v-shaped” pattern – recovering almost as quickly as it declined. The red arrow on the chart represents about three months and one week, while the green arrow represents just under four months – almost an equal amount of time! The key lesson for investors to remember: volatility works both ways.
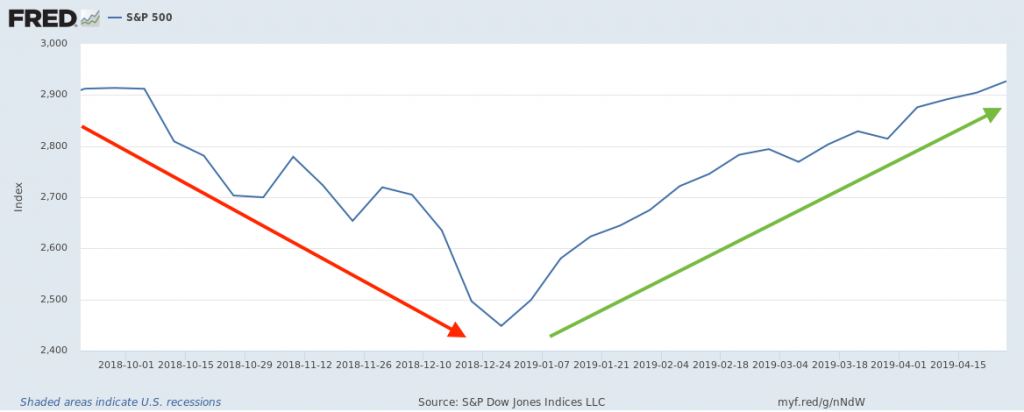
Source: Federal Reserve Bank of St. Louis
Lesson #2: Late in an Economic Cycle, Fed Policy Matters (A Lot)
The Federal Reserve’s shifting position on monetary policy has been a crucial driver of market movements in the last six months, in my view.
The synchronization is almost aligned to the day. On September 26, the Federal Reserve raises rates a quarter point, and the market enters a downturn.4 On December 19, the Federal Reserve raises rates again, and some of the steepest drops occur leading up to Christmas Eve.5 Then, between Christmas and the new year, the Federal Reserve starts to tone down hawkish language, vowing “patience” and giving the market a signal that it may pause hikes in 2019 (market starts to rally). Finally, on January 30, the Fed says “the case for raising rates has weakened somewhat,” with the market seeing this statement as the Fed fully walking back its previous position. With the market now expecting no further rate hikes in 2019, the market arguably locked into an uptrend that has now seen it reclaim an all-time high.
As mentioned, no further rate hikes are expected in 2019. But investors would be wise to keep an eye on all Fed meetings and minutes moving forward. Since the interest rate ‘pause’ has given stocks more runway for moving higher, we believe that once rate hikes re-enter the picture, we should reasonably expect the headwinds to return.
Lesson #3: Beware the Temptation of Technology IPOs
2019 is by many accounts the “year of the IPO,” with several of the biggest and trendiest names in tech set to start trading on the public markets (think Uber, Lyft, Pinterest, Slack, etc.). These are exciting names for market watchers, particularly those who follow the tech sector closely. Some of these companies have revolutionary technology that could change the nature of the economy and jobs in big ways.
But most of them aren’t profitable yet, and I believe investors should proceed with caution.
According to University of Florida finance professor, Jay Ritter, in 2018 “81% of American companies were unprofitable in the year leading up to their public offerings.” 81%!6
Remember that at the end of the day, billion-dollar valuations for new IPOs is by no means an indication that the company is stable and has a bright future. A billion-dollar valuation does not mean the company is producing billions of dollars in revenue or that it makes a nickel of profit! A recent study by the National Bureau of Economic Research concluded that, on average, “unicorns” are approximately 50 percent overvalued. And when a company is overvalued, the market won’t take long to adjust its share price.7
Our research clearly shows that the stock of profitable companies as measured by either historical or projected earnings per share outperform the stock of unprofitable companies. We think this could contribute to why recent IPOs underperform over time – until profitability is consistent the stock of a recent IPO is being purchased on the story being told not the fundamentals.
Bottom Line for Investors
The first quarter delivered a much-needed respite from the downside volatility endured during Q4 2018. But it also serves as a key reminder that volatility works both ways, and that trying to time the markets or predict what will happen is often a feckless pursuit. Similarly, investors may try to get in front of a Fed policy decision or to get in early on an IPO, but there are substantial risks to both. Sometimes the best results are achieved by stepping away from the noise and choosing patience and a long-term mindset instead. That’s what I would do.
In the meantime, I recommend keeping an eye on stay fundamentals and staying focused on the entire market picture. To help you do this, you are invited to download our Just-Released Stock Market Outlook report for May 2019.
This Special Report is packed with our newly revised predictions for Q2 and the remainder of 2019 that we believe can help you base your next investment move on hard data.
For example, you’ll discover Zacks’ view on:
- For how long will 2019 stay bullish?
- Zacks global markets’ outlook
- What sectors show the best opportunity?
- What industries within those sectors most merit your attention?
- Forecast for the S&P
- Small-cap vs. large-cap returns
- And much more.
If you have $500,000 or more to invest and want to learn more about these forecasts, click on the link below to get your free report today!
IT’S FREE. Download the Just-Released May 2019 Stock Market Outlook8
Disclosure
2 Strategas Quarterly Review in Charts, April 1, 2019
3 Yahoo Finance, April 30, 2019. https://finance.yahoo.com/quote/%5EGSPC/chart
4 USA Today, September 26, 2018, https://www.usatoday.com/story/money/2018/09/26/fed-raises-rate/1426946002/
5 CNBC, December 19, 2018. https://www.cnbc.com/2018/12/19/fed-hikes-rates-by-a-quarter-point-.html
6 The Wall Street Journal, October 1, 2019. https://www.wsj.com/articles/red-ink-floods-ipo-market-1538388000
7 CNBC, May 22, 2018. https://www.cnbc.com/2018/05/22/tech-bubble-is-larger-than-in-2000-and-the-end-is-coming.html
8 Zacks Investment Management reserves the right to amend the terms or rescind the free Stock Market Outlook offer at any time and for any reason at its discretion.
DISCLOSURE
Past performance is no guarantee of future results. Inherent in any investment is the potential for loss.
Zacks Investment Management, Inc. is a wholly-owned subsidiary of Zacks Investment Research. Zacks Investment Management is an independent Registered Investment Advisory firm and acts as an investment manager for individuals and institutions. Zacks Investment Research is a provider of earnings data and other financial data to institutions and to individuals.
This material is being provided for informational purposes only and nothing herein constitutes investment, legal, accounting or tax advice, or a recommendation to buy, sell or hold a security. Do not act or rely upon the information and advice given in this publication without seeking the services of competent and professional legal, tax, or accounting counsel. Publication and distribution of this article is not intended to create, and the information contained herein does not constitute, an attorney-client relationship. No recommendation or advice is being given as to whether any investment or strategy is suitable for a particular investor. It should not be assumed that any investments in securities, companies, sectors or markets identified and described were or will be profitable. All information is current as of the date of herein and is subject to change without notice. Any views or opinions expressed may not reflect those of the firm as a whole.
Any projections, targets, or estimates in this report are forward looking statements and are based on the firm’s research, analysis, and assumptions. Due to rapidly changing market conditions and the complexity of investment decisions, supplemental information and other sources may be required to make informed investment decisions based on your individual investment objectives and suitability specifications. All expressions of opinions are subject to change without notice. Clients should seek financial advice regarding the appropriateness of investing in any security or investment strategy discussed in this presentation.
Certain economic and market information contained herein has been obtained from published sources prepared by other parties. Zacks Investment Management does not assume any responsibility for the accuracy or completeness of such information. Further, no third party has assumed responsibility for independently verifying the information contained herein and accordingly no such persons make any representations with respect to the accuracy, completeness or reasonableness of the information provided herein. Unless otherwise indicated, market analysis and conclusions are based upon opinions or assumptions that Zacks Investment Management considers to be reasonable. Any investment inherently involves a high degree of risk, beyond any specific risks discussed herein.
It is not possible to invest directly in an index. Investors pursuing a strategy similar to an index may experience higher or lower returns, which will be reduced by fees and expenses.
The S&P 500 Index is a well-known, unmanaged index of the prices of 500 large-company common stocks, mainly blue-chip stocks, selected by Standard & Poor’s. The S&P 500 Index assumes reinvestment of dividends but does not reflect advisory fees. The volatility of the benchmark may be materially different from the individual performance obtained by a specific investor. An investor cannot invest directly in an index.