The stock market’s sustained rally since the March 23 lows had many investors feeling good about the recovery. The stock market climbed back to new highs as the pandemic’s threat to economic growth moderated, and investors started looking ahead to next year when corporate earnings might recover in earnest.
Then the volatility arrived.
Two weeks ago, the Nasdaq recorded its worst week since the bear market, led lower by some of the biggest names in Tech. The S&P 500 ended that week -2.3% lower, with the Nasdaq dropping -4%. Last week saw a continuation of the selling pressure, with global stocks recording their first back-to-back weekly decline since March.1 Investors seemed worried that Congress would not come to an agreement regarding more fiscal stimulus.
I expect the volatility to continue in the coming weeks – which to me means the likelihood of investor missteps will also go up. The investment community tends to view volatility as an opportunity to take gains off the table, to trade in-and-out of stocks in an effort to ‘buy the dip,’ or in some cases, as a reason to avoid investing in stocks altogether. But I think these approaches tend to result in mistakes – which can ultimately detract from long-term returns.
______________________________________________________________________________
Make the Most of Your Long-term Returns
Volatility has arrived and with it comes many fears and unknowns. To help you navigate this turbulent time, we are offering an exclusive look into our just-released October Stock Market Outlook Report.
This report will help you make decisions based on data and fundamentals instead of fears and media hysteria. This report contains some of our key forecasts to consider such as:
- Should you be worried about the 2020 Presidential Election?
- What stocks could go up when vaccine distribution rolls out?
- Signs of recovery in certain sectors
- What of U.S. GDP Growth?
- An update on U.S. fiscal stimulus
- U.S. returns expectations for 2020
- What produces 2020 optimism?
- And much more.
If you have $500,000 or more to invest and want to learn more about these forecasts, click on the link below to get your free report today!
IT’S FREE. Download the Just-Released October 2020 Stock Market Outlook2
_____________________________________________________________________________
Take the approaches of trading in-and-out of stocks to either generate profits or to buy stocks that have pulled back. Even though market volatility often presents itself as an opportunity to make some strategic changes, investors often forget that volatility works both ways (up and down), is very unpredictable, and often happens in clusters. Selling pressure one week may not mean selling pressure the next, and investors can get caught waiting for a trade that never materializes.
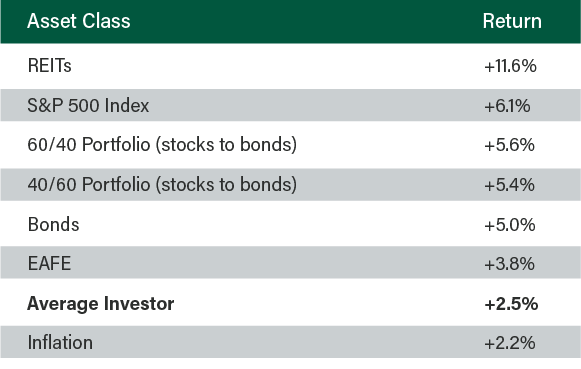
The desire to take advantage of volatility and to time the market is one of the main reasons the average investor underperforms over time, in my view. Below you can see the 20-year (1999-2019) annualized returns by asset class. According to the research firm Dalbar, the average investor is near the bottom of the return spectrum. Bad timing decisions are largely to blame, in my view.
20-Year Annualized Returns by Asset Class (1999-2019)
One key thing that investors must remember is that there are two sides to every trade. Any time you make a decision to buy or sell a stock – particularly if you’re basing your decision on a gut feeling or as an emotional response to volatility – there is some trader, money manager, or institution on the other side of the trade that may have better information than you. Timing the market based on limited information or an emotional response is like playing a golf match against Tiger Woods. Over the course of the 18-hole match, you might hit a few better shots than him, and maybe even get a better score on a couple of holes. But long-term, there is basically zero chance of winning.
Another potential reaction to volatility is deciding to go to cash and wait on the sidelines, or to perhaps hold off on investing any new dollars in the market. But this approach is just another form of market timing – the investor is assuming that the market will keep going down and he/she will buy just at the right time. The reality: the time spent waiting is time out of the market, which over the long-term, tends to work against investors.
Bottom Line for Investors
With the election fast approaching and uncertainty about the growth trajectory of the U.S. economy, I expect volatility to continue apace in the coming months. Looking back at the last seven U.S. presidential elections, the CBOE Volatility Index (VIX) has risen an average of approximately four points in the month leading up election day.4 Investors should reasonably expect some bumpiness this time around, too.
With increased volatility tends to come increased desire to “do something,” or to make changes or trades in investment portfolios. But doing so tends to lead to more mistakes, in my view, which can ultimately detract from long-term returns.
Instead of trying to “do something,” I recommend sticking to the hard data and key fundamentals. To help you do this, I am offering all readers our Just-Released October 2020 Stock Market Outlook Report.
This Special Report is packed with newly revised predictions that can help you base your next investment move on hard data. For example, you’ll discover Zacks’ view on:
- Should you be worried about the 2020 Presidential Election?
- What stocks could go up when vaccine distribution rolls out?
- Signs of recovery in certain sectors
- What of U.S. GDP Growth?
- An update on U.S. fiscal stimulus
- U.S. returns expectations for 2020
- What produces 2020 optimism?
- And much more.
If you have $500,000 or more to invest and want to learn more about these forecasts, click on the link below to get your free report today!5
Disclosure
2 Zacks Investment Management reserves the right to amend the terms or rescind the free Stock Market Outlook offer at any time and for any reason at its discretion.
3 J.P. Morgan, August 31, 2020. https://am.jpmorgan.com/us/en/asset-management/gim/adv/insights/guide-to-the-markets/viewer
4 The Wall Street Journal. January 22, 2020. https://www.wsj.com/articles/options-markets-brace-for-election-volatility-11579694401
5 Zacks Investment Management reserves the right to amend the terms or rescind the free Stock Market Outlook offer at any time and for any reason at its discretion.
DISCLOSURE
Past performance is no guarantee of future results. Inherent in any investment is the potential for loss.
Zacks Investment Management, Inc. is a wholly-owned subsidiary of Zacks Investment Research. Zacks Investment Management is an independent Registered Investment Advisory firm and acts as an investment manager for individuals and institutions. Zacks Investment Research is a provider of earnings data and other financial data to institutions and to individuals.
This material is being provided for informational purposes only and nothing herein constitutes investment, legal, accounting or tax advice, or a recommendation to buy, sell or hold a security. Do not act or rely upon the information and advice given in this publication without seeking the services of competent and professional legal, tax, or accounting counsel. Publication and distribution of this article is not intended to create, and the information contained herein does not constitute, an attorney-client relationship. No recommendation or advice is being given as to whether any investment or strategy is suitable for a particular investor. It should not be assumed that any investments in securities, companies, sectors or markets identified and described were or will be profitable. All information is current as of the date of herein and is subject to change without notice. Any views or opinions expressed may not reflect those of the firm as a whole.
Any projections, targets, or estimates in this report are forward looking statements and are based on the firm’s research, analysis, and assumptions. Due to rapidly changing market conditions and the complexity of investment decisions, supplemental information and other sources may be required to make informed investment decisions based on your individual investment objectives and suitability specifications. All expressions of opinions are subject to change without notice. Clients should seek financial advice regarding the appropriateness of investing in any security or investment strategy discussed in this presentation.
Certain economic and market information contained herein has been obtained from published sources prepared by other parties. Zacks Investment Management does not assume any responsibility for the accuracy or completeness of such information. Further, no third party has assumed responsibility for independently verifying the information contained herein and accordingly no such persons make any representations with respect to the accuracy, completeness or reasonableness of the information provided herein. Unless otherwise indicated, market analysis and conclusions are based upon opinions or assumptions that Zacks Investment Management considers to be reasonable. Any investment inherently involves a high degree of risk, beyond any specific risks discussed herein.
The S&P 500 Index is a well-known, unmanaged index of the prices of 500 large-company common stocks, mainly blue-chip stocks, selected by Standard & Poor’s. The S&P 500 Index assumes reinvestment of dividends but does not reflect advisory fees. The volatility of the benchmark may be materially different from the individual performance obtained by a specific investor. An investor cannot invest directly in an index.
The Russell 1000 Growth Index is a well-known, unmanaged index of the prices of 1000 large-company growth common stocks selected by Russell. The Russell 1000 Growth Index assumes reinvestment of dividends but does not reflect advisory fees. An investor cannot invest directly in an index. The volatility of the benchmark may be materially different from the individual performance obtained by a specific investor.
Nasdaq Composite Index is the market capitalization-weighted index of over 3,300 common equities listed on the Nasdaq stock exchange. The types of securities in the index include American depositary receipts, common stocks, real estate investment trusts (REITs) and tracking stocks, as well as limited partnership interests. The index includes all Nasdaq-listed stocks that are not derivatives, preferred shares, funds, exchange-traded funds (ETFs) or debenture securities. An investor cannot invest directly in an index. The volatility of the benchmark may be materially different from the individual performance obtained by a specific investor.
The VIX Index is a calculation designed to produce a measure of constant, 30-day expected volatility of the U.S. stock market, derived from real-time, mid-quote prices of S&P 500® Index (SPXSM) call and put options. On a global basis, it is one of the most recognized measures of volatility -- widely reported by financial media and closely followed by a variety of market participants as a daily market indicator. An investor cannot invest directly in an index. The volatility of the benchmark may be materially different from the individual performance obtained by a specific investor.