When 2020 started, my biggest concerns were an escalating trade war with China and geopolitical tensions with Iran. No one could have anticipated that by October, some 25 million Americans would be collecting unemployment benefits1 while the nation remains locked in an 8-month battle with a global pandemic.
Now, we’re one month away from what is perhaps the most emotionally-charged – and uncertain – presidential election in modern U.S. history. What does this all mean for equity markets in Q4?
For insight, I am going to start with an objective history of elections, politics, and the stock market. Anytime I venture into the political sphere, I remind readers that my approach to politics is agnostic – I do not favor one outcome over another. My concern is the economic cycle, corporate earnings, and to a lesser extent, how policy may impact the trajectory of the recovery.
_________________________________________________________________________
How Could the Election Impact Market Recovery?
2020 is no stranger to volatility and the fears and unknowns that come with it. The upcoming election only adds one more unknown to the pile. How could the outcome impact the markets and the economic recovery? Get insight into this question and many more with out just-released October Stock Market Outlook Report.
This report will help you make decisions based on data and fundamentals instead of fears and media hysteria. This report contains some of our key forecasts to consider such as:
- Should you be worried about the 2020 Presidential Election?
- What stocks could go up when vaccine distribution rolls out?
- Signs of recovery in certain sectors
- What of U.S. GDP Growth?
- U.S. returns expectations for 2020
- What produces 2020 optimism?
- And much more
If you have $500,000 or more to invest and want to learn more about these forecasts, click on the link below to get your free report today!
IT’S FREE. Download the Just-Released October 2020 Stock Market Outlook2
_________________________________________________________________________
Regarding history, it is common in presidential election years for investors to assume their political party is better for the stock market. Others may believe a specific balance of power within the executive and legislative branches delivers the best results. History says the stock market goes up regardless of how power is divided:
S&P 500 Average Annual Performance, 1933 – 2019
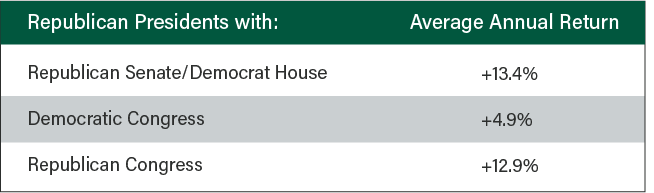
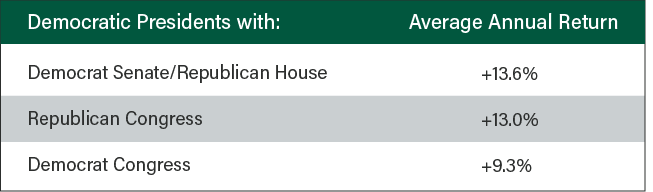
If you’re wondering why returns are missing for a Democratic president, Democratic House, and a Republican Senate, it’s because the last time the U.S. had this balance of power was in 1886!
Some market historians may note that Democratic presidents have been better for equity market returns. Since 1933, for example, Democratic presidents have experienced higher stock market returns than Republican presidents. But if we strip-out the outsized gains during the 90’s tech boom (Clinton) and the declines of the dot-com bust and 2007-2008 Financial Crisis (Bush), then the difference in returns between Democrats and Republicans is essentially zero.4 In my view, market and business cycles over the long-term matter more than political parties do.
I am not going to get into the weeds on taxes or tax policy here, mainly because any tax plans made during the campaign rarely materialize as advertised. What I will note, however, is that many believe a Biden win would mean higher corporate and top-end tax rates, which is a perceived negative for earnings and equity markets. Once again turning to history, I cannot find strong evidence that marginally higher taxes adversely impact long-term equity returns.
The biggest sustained increase to corporate tax rates occurred in the 1940s and 1950s, with the tax rate topping 50%.5 As corporate tax rates soared during and after World War II, the stock market was hardly fazed. During the 1940s, the S&P 500’s total return was +143.10%, and during the 1950s the index jumped +467.40%.6
Corporate Tax Rates from 1920 to Present
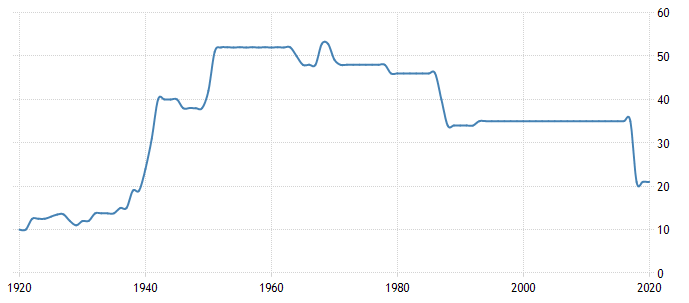
Same goes for personal income tax rates. The Biden campaign has proposed raising individual tax rates for those earning over $400,000 to 39.6% from 37%, while also proposing a slight increase to Social Security payroll taxes on the high end of the income spectrum.8 Relative to history, these proposed changes are marginal – the top tax rate was above 90% for all of the 1950s, and as mentioned the S&P 500 went up 467.4% over that decade.9 Taxes matter, but the economy and the market can absorb higher tax rates better than most people think, in my view.
One last point to make is regarding volatility surrounding the election. The uncertain nature of the voting process and perhaps the result has many thinking the stock market will be volatile in Q4. I do not disagree. But in my view, long-term investment strategies should not attempt to factor-in the possibility of short-term volatility. I also think fear of election mayhem may already be priced into stocks, which to me means if we can avoid a worst-case scenario, stocks could deliver an upside surprise.
At the end of the day, no one knows how this election will unfold. But I do know and believe that changing your long-term strategy because of a short-term unknown is not a prudent approach – it hasn’t been throughout history, and I do not think special circumstances make it prudent today.
Bottom Line for Investors
Over time, the stock market responds more to long-term earnings and economic growth trends – not to changes in political leadership. The emotional gravity of an election – and in particular this one – may make it appear as though the outcome will make or break the nation. But I believe this mindset puts far too much emphasis on political figures and policies, and far too little emphasis on the real engines of the U.S. economy – corporate earnings, small business growth, investment, the consumer, and innovation. Politicians come and go, but the desire to grow, innovate, and pursue profit remains a constant.
To help you focus on these important data points and key fundamentals that drive the U.S. economy, I am offering all readers our Just-Released October 2020 Stock Market Outlook Report.
This Special Report is packed with newly revised predictions that can help you base your next investment move on hard data. For example, you’ll discover Zacks’ view on:
- Should you be worried about the 2020 Presidential Election?
- What stocks could go up when vaccine distribution rolls out?
- Signs of recovery in certain sectors
- What of U.S. GDP Growth?
- U.S. returns expectations for 2020
- What produces 2020 optimism?
- And much more
If you have $500,000 or more to invest and want to learn more about these forecasts, click on the link below to get your free report today!10
Disclosure
2 Zacks Investment Management reserves the right to amend the terms or rescind the free Stock Market Outlook offer at any time and for any reason at its discretion.
3 Strategas Quarterly Review in Charts, July 1, 2020.
4 Fiduciary Trust International, July 21, 2020. https://www.fiduciarytrust.com/insights/commentary
5 Trading Economics, 2020 data. https://tradingeconomics.com/united-states/corporate-tax-rate
6 Seeking Alpha, December 30, 2020. https://seekingalpha.com/article/2789035-s-and-p-500-index-returns-by-decade-since-1940
7 Trading Economics, 2020 data. https://tradingeconomics.com/united-states/corporate-tax-rate
8 AP, September 13, 2020. https://apnews.com/article/archive-joe-biden-donald-trump-2e319858f049ddf25d975476455b7305
9 Seeking Alpha, December 30. 2020. https://seekingalpha.com/article/2789035-s-and-p-500-index-returns-by-decade-since-1940
10 Zacks Investment Management reserves the right to amend the terms or rescind the free Stock Market Outlook offer at any time and for any reason at its discretion.
DISCLOSURE
Past performance is no guarantee of future results. Inherent in any investment is the potential for loss.
Zacks Investment Management, Inc. is a wholly-owned subsidiary of Zacks Investment Research. Zacks Investment Management is an independent Registered Investment Advisory firm and acts as an investment manager for individuals and institutions. Zacks Investment Research is a provider of earnings data and other financial data to institutions and to individuals.
This material is being provided for informational purposes only and nothing herein constitutes investment, legal, accounting or tax advice, or a recommendation to buy, sell or hold a security. Do not act or rely upon the information and advice given in this publication without seeking the services of competent and professional legal, tax, or accounting counsel. Publication and distribution of this article is not intended to create, and the information contained herein does not constitute, an attorney-client relationship. No recommendation or advice is being given as to whether any investment or strategy is suitable for a particular investor. It should not be assumed that any investments in securities, companies, sectors or markets identified and described were or will be profitable. All information is current as of the date of herein and is subject to change without notice. Any views or opinions expressed may not reflect those of the firm as a whole.
Any projections, targets, or estimates in this report are forward looking statements and are based on the firm’s research, analysis, and assumptions. Due to rapidly changing market conditions and the complexity of investment decisions, supplemental information and other sources may be required to make informed investment decisions based on your individual investment objectives and suitability specifications. All expressions of opinions are subject to change without notice. Clients should seek financial advice regarding the appropriateness of investing in any security or investment strategy discussed in this presentation.
Certain economic and market information contained herein has been obtained from published sources prepared by other parties. Zacks Investment Management does not assume any responsibility for the accuracy or completeness of such information. Further, no third party has assumed responsibility for independently verifying the information contained herein and accordingly no such persons make any representations with respect to the accuracy, completeness or reasonableness of the information provided herein. Unless otherwise indicated, market analysis and conclusions are based upon opinions or assumptions that Zacks Investment Management considers to be reasonable. Any investment inherently involves a high degree of risk, beyond any specific risks discussed herein.
The S&P 500 Index is a well-known, unmanaged index of the prices of 500 large-company common stocks, mainly blue-chip stocks, selected by Standard & Poor’s. The S&P 500 Index assumes reinvestment of dividends but does not reflect advisory fees. The volatility of the benchmark may be materially different from the individual performance obtained by a specific investor. An investor cannot invest directly in an index.
The Russell 1000 Growth Index is a well-known, unmanaged index of the prices of 1000 large-company growth common stocks selected by Russell. The Russell 1000 Growth Index assumes reinvestment of dividends but does not reflect advisory fees. An investor cannot invest directly in an index. The volatility of the benchmark may be materially different from the individual performance obtained by a specific investor.
Nasdaq Composite Index is the market capitalization-weighted index of over 3,300 common equities listed on the Nasdaq stock exchange. The types of securities in the index include American depositary receipts, common stocks, real estate investment trusts (REITs) and tracking stocks, as well as limited partnership interests. The index includes all Nasdaq-listed stocks that are not derivatives, preferred shares, funds, exchange-traded funds (ETFs) or debenture securities. An investor cannot invest directly in an index. The volatility of the benchmark may be materially different from the individual performance obtained by a specific investor.
The VIX Index is a calculation designed to produce a measure of constant, 30-day expected volatility of the U.S. stock market, derived from real-time, mid-quote prices of S&P 500® Index (SPXSM) call and put options. On a global basis, it is one of the most recognized measures of volatility -- widely reported by financial media and closely followed by a variety of market participants as a daily market indicator. An investor cannot invest directly in an index. The volatility of the benchmark may be materially different from the individual performance obtained by a specific investor.