Over the past four years, U.S. government debt held by the public has swelled from about $14 trillion to over $21 trillion. Debt as a percent of U.S. GDP now tops 100%, meaning our debt exceeds our annual output. Debt as a percent of GDP has not been this high since World War II (chart below), when the U.S. economy was firing on all cylinders for wartime production.1
Debt as a Percent of GDP Now Tops 100%
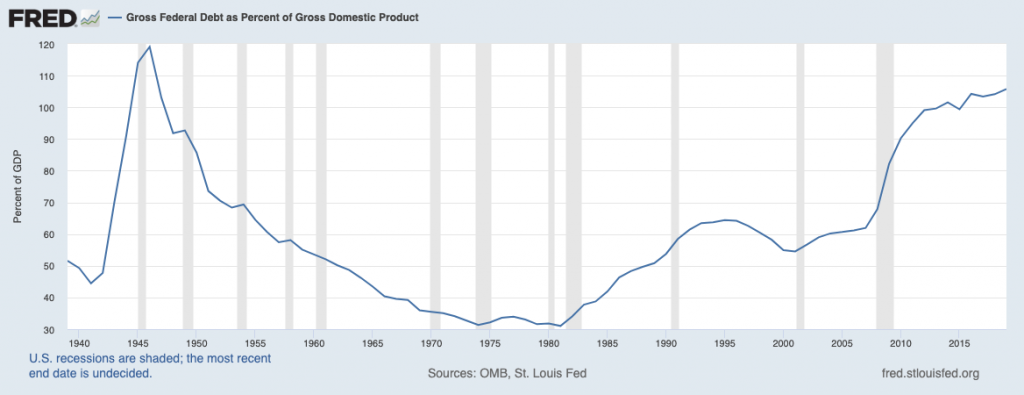
Source: Federal Reserve Bank of St. Louis2
__________________________________________________________________________
Focus on These Key Data Points Instead of Market Uncertainties!
While there are a lot of uncertainties impacting the market like inflation, debt, the pandemic and more, focusing too much on these fears and uncertainties could negatively impact your long-term investments. Instead of focusing on fears and uncertainties, I recommend focusing on hard data and key economic indicators that could impact your investments in the long-term. It’s better to focus on the facts and data when it comes to making future decisions!
To help you do this, I am offering all readers our just-released Stock Market Outlook report. This report contains some of our key forecasts to consider such as:
- Economic expectations for 2021
- 2021 capital markets expectations
- A look at Covid-19 and vaccine distribution
- What produces 2021 optimism?
- What of U.S. GDP growth?
- A look at U.S. continuing claims for unemployment and Covid job data
- Zacks Rank S&P 500 Sector Picks
- And much more
If you have $500,000 or more to invest and want to learn more about these forecasts, click on the link below to get your free report today!
IT’S FREE. Download the Just-Released February 2021 Stock Market Outlook3
__________________________________________________________________________
Having debt at 100+% of GDP places the United States in the ranks with countries like Greece, Italy, and Japan. For many investors, this alone is troubling.
Over the long-term, I fully agree the current path of debt accumulation and deficit spending is not sustainable. With Social Security and Medicare/Medicaid payments also ballooning, the U.S. is on track to have debt be 200% of annual GDP by 2050. Never-ending deficit spending and exorbitant debt to GDP ratios will make any country’s debt less desirable, pushing interest rates higher and higher in the process. The cycle cannot continue forever.
Short-term, however, I do not see many problems with the United States borrowing more and spending more at the federal level. In fact, if there were ever a time to spend our way out of a crisis, now is probably it. Allow me to explain.
In 2020, U.S. debt increased by $4 trillion, which marked a significant 25% jump from 2019 levels. Here is the kicker, however: while absolute levels of debt increased dramatically, the interest payments on that debt decreased by 8%.For new or existing homeowners who decided to refinance or buy a second home (or a bigger home) during this period of ultra-low interest rates, you can understand the appeal of borrowing more when it’s inexpensive to do so.
To offer a contrasting example, the last time the U.S. ran budget surpluses was in the 1990’s, when 10-year U.S. Treasuries – and by extension borrowing costs – exceeded 6% for most of the decade. Inflation was also a concern. In periods like the 90s, when the economy was also expanding at a strong clip, deficit spending was not needed nor was it incentivized. In a sense, it is the opposite of what we have today.
As a general rule, if the economic growth rate is higher than long-term interest rates (10-year and 30-year U.S. Treasuries), then countries should be able to run moderate budget deficits while maintaining a reasonable cost of servicing debt. Today, we’re expecting 2021 and 2022 GDP growth in excess of 2%, and as I write the 30-year U.S. Treasury is 1.80%.4 The cost of servicing debt should remain very manageable and relatively attractive in the coming years, in my view. But the window will not last forever.
Bottom Line for Investors
The key takeaway here – and the reason not to worry about debt and deficits now – is that the U.S.’s ability to borrow and service debt at a very low cost (interest rates) matters more than our absolute level of debt.
In a debt crisis, investors would worry about a country’s ability to make interest payments and repay debt, which would push interest rates higher – not lower. You may remember Greece in the years following the 2008 financial crisis when bond yields soared and the country could not sell bonds in the debt markets. The European Central Bank had to step in to buy Greek debt and backstop outstanding debt, and eventually, Greece was able to re-enter the debt markets.
The United States does not have this problem today. As the most diverse and wealthiest economy in the world, I think it’s clear that global investors not only want our debt, but covet it. In spite of all of the world’s and the U.S.’s current problems, U.S. Treasury bonds are still considered among the safest investments in the world. This notion may puzzle many investors given the political/economic climate, but you don’t need to take my word for it. Just look at our interest rates.
Giving in to fear and uncertainties could mean missing out on positives in store for the market this year. To help better position yourself for what’s to come, I recommend focusing on what matters – key data points and economic indicators that could impact your investments. To help you do this, I am offering all readers our Just-Released February 2021 Stock Market Outlook Report.
This report looks at several factors that are producing optimism right now and contains some of our key forecasts to consider such as:
- Economic expectations for 2021
- 2021 capital markets expectations
- A look at Covid-19 and vaccine distribution
- What produces 2021 optimism?
- What of U.S. GDP growth?
- A look at U.S. continuing claims for unemployment and Covid job data
- Zacks Rank S&P 500 Sector Picks
- And much more
If you have $500,000 or more to invest and want to learn more about these forecasts, click on the link below to get your free report today!
Disclosure
2 Fred Economic Data. July 30, 2021. https://fred.stlouisfed.org/series/GFDGDPA188S
3 Zacks Investment Management reserves the right to amend the terms or rescind the free Stock Market Outlook offer at any time and for any reason at its discretion.
4 U.S Department of the Treasury. January 25, 2021. https://www.treasury.gov/resource-center/data-chart-center/interest-rates/pages/textview.aspx?data=yield
5 Zacks Investment Management reserves the right to amend the terms or rescind the free Stock Market Outlook offer at any time and for any reason at its discretion.
DISCLOSURE
Past performance is no guarantee of future results. Inherent in any investment is the potential for loss.
Zacks Investment Management, Inc. is a wholly-owned subsidiary of Zacks Investment Research. Zacks Investment Management is an independent Registered Investment Advisory firm and acts as an investment manager for individuals and institutions. Zacks Investment Research is a provider of earnings data and other financial data to institutions and to individuals.
This material is being provided for informational purposes only and nothing herein constitutes investment, legal, accounting or tax advice, or a recommendation to buy, sell or hold a security. Do not act or rely upon the information and advice given in this publication without seeking the services of competent and professional legal, tax, or accounting counsel. Publication and distribution of this article is not intended to create, and the information contained herein does not constitute, an attorney-client relationship. No recommendation or advice is being given as to whether any investment or strategy is suitable for a particular investor. It should not be assumed that any investments in securities, companies, sectors or markets identified and described were or will be profitable. All information is current as of the date of herein and is subject to change without notice. Any views or opinions expressed may not reflect those of the firm as a whole.
Any projections, targets, or estimates in this report are forward looking statements and are based on the firm’s research, analysis, and assumptions. Due to rapidly changing market conditions and the complexity of investment decisions, supplemental information and other sources may be required to make informed investment decisions based on your individual investment objectives and suitability specifications. All expressions of opinions are subject to change without notice. Clients should seek financial advice regarding the appropriateness of investing in any security or investment strategy discussed in this presentation.
Certain economic and market information contained herein has been obtained from published sources prepared by other parties. Zacks Investment Management does not assume any responsibility for the accuracy or completeness of such information. Further, no third party has assumed responsibility for independently verifying the information contained herein and accordingly no such persons make any representations with respect to the accuracy, completeness or reasonableness of the information provided herein. Unless otherwise indicated, market analysis and conclusions are based upon opinions or assumptions that Zacks Investment Management considers to be reasonable. Any investment inherently involves a high degree of risk, beyond any specific risks discussed herein.
The S&P 500 Index is a well-known, unmanaged index of the prices of 500 large-company common stocks, mainly blue-chip stocks, selected by Standard & Poor’s. The S&P 500 Index assumes reinvestment of dividends but does not reflect advisory fees. The volatility of the benchmark may be materially different from the individual performance obtained by a specific investor. An investor cannot invest directly in an index.
The Russell 1000 Growth Index is a well-known, unmanaged index of the prices of 1000 large-company growth common stocks selected by Russell. The Russell 1000 Growth Index assumes reinvestment of dividends but does not reflect advisory fees. An investor cannot invest directly in an index. The volatility of the benchmark may be materially different from the individual performance obtained by a specific investor.
Nasdaq Composite Index is the market capitalization-weighted index of over 3,300 common equities listed on the Nasdaq stock exchange. The types of securities in the index include American depositary receipts, common stocks, real estate investment trusts (REITs) and tracking stocks, as well as limited partnership interests. The index includes all Nasdaq-listed stocks that are not derivatives, preferred shares, funds, exchange-traded funds (ETFs) or debenture securities. An investor cannot invest directly in an index. The volatility of the benchmark may be materially different from the individual performance obtained by a specific investor.
“The Dow Jones Industrial Average measures the daily stock market movements of 30 U.S. publicly-traded companies listed on the NASDAQ or the New York Stock Exchange (NYSE). The 30 publicly-owned companies are considered leaders in the United States economy. An investor cannot directly invest in an index. The volatility of the benchmark may be materially different from the individual performance obtained by a specific investor.”