The U.S. economy is growing, vaccination rates are slowing but remain elevated, and restrictions are falling away quickly. Pandemic risks are falling, and corporations are posting very strong earnings numbers.1
Yet, even still, we keep hearing about inflation concerns, labor market shortages, supply chain bottlenecks, too much government spending, and frothy asset classes. Don’t get me wrong – every one of those economic fundamentals matters greatly. But I also think it’s true that corporate earnings matter more, and no one seems to want to talk about it. Instead, the “wall of worry” continues to dominate the headlines, and I think that’s good news for stocks.
__________________________________________________________________________
Taking Cues from Headlines May Be Costly…Time to Focus on the Fundamentals
The pressures of fearful headlines and media hysteria may cause investors to worry and make knee-jerk responses. Instead of letting these factors affect your current financial goals, I recommend making decisions based on data and fundamentals. To help you do this, I am offering all readers our just-released Stock Market Outlook report. This report contains some of our key forecasts to consider such as:
- Zacks rank S&P 500 sector picks
- Zacks June view on equity markets
- What produces 2021 optimism?
- Zacks forecasts for the remainder of the year
- Top stocks in top industries
- Sell-side and buy-side consensus
- And much more
If you have $500,000 or more to invest and want to learn more about these forecasts, click on the link below to get your free report today!
IT’S FREE. Download the Just-Released June 2021 Stock Market Outlook2
__________________________________________________________________________
As I write, 477 S&P 500 have reported Q1 2021 earnings, and the results were arguably historic. 86% of reporting companies beat earnings-per-share estimates and 77.4% beat revenue estimates. These are big numbers.
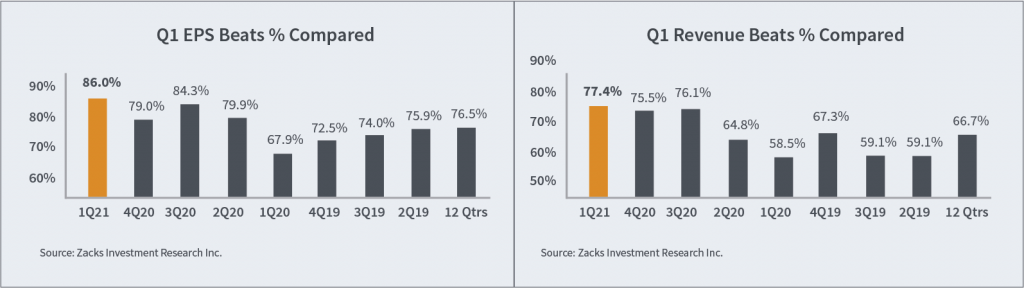
Earnings for reporting companies were up +48.4% from the same period last year, on +10.1% higher revenues. Of course, these figures come with an asterisk – the same period last year included March 2020, when the pandemic ravaged the economy. Looking ahead to Q2 2021 earnings, we could see an even bigger year-over-year jump, given the effect of the global economic shutdown in Q2 2020.
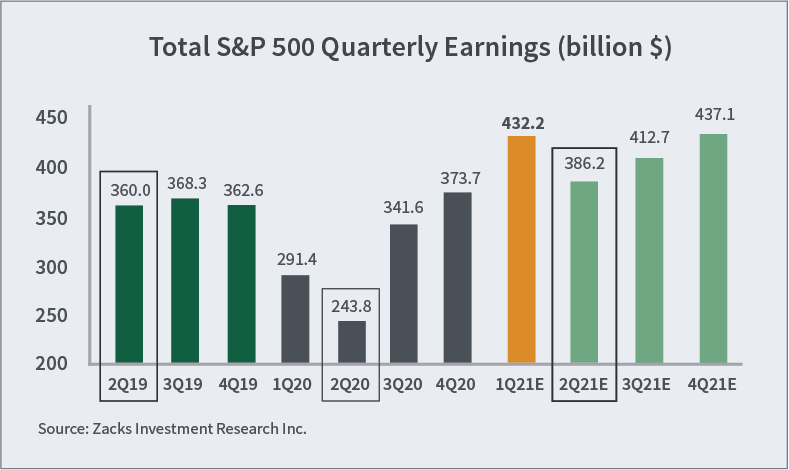
Investors should keep in mind, though, that strong earnings in Q1 2021 and the even stronger growth expected in Q2 are also reflective of strong growth in an absolute sense, not just because of low 2020 comparisons. The chart below demonstrates how total quarterly earnings in Q1 2021 far surpassed anything we’ve seen previously, with Q2 2021 (estimated) expected to be +7.3% higher than Q2 2019 (a fairer comparison).
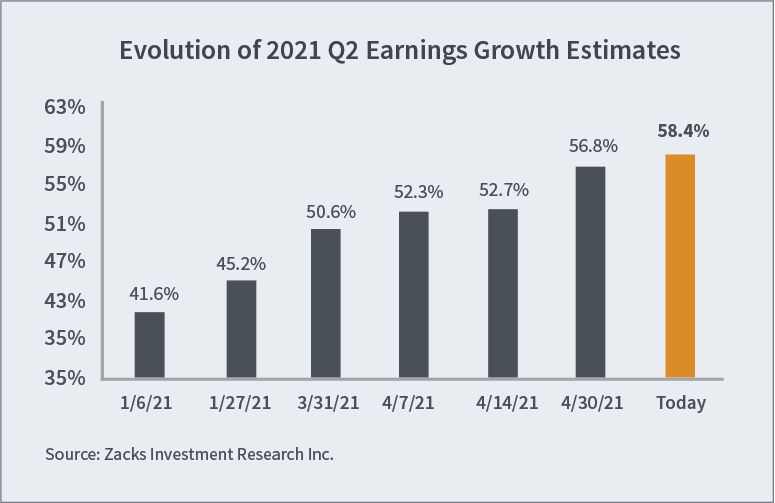
Another key bullish factor in the earnings arena is earnings estimates, which play an important role in Zacks Investment Management’s stock selection process. We look for strong earnings performance in general, but we also look for companies that consistently push earnings estimates higher and beat their estimates a high percentage of the time. Long-term, owning the earnings generators usually bodes well for total return.
In the chart below, you can see how Q2 2021 earnings growth estimates have pushed higher over the last several months, which is a strong signal that CEOs are thinking optimistically about how the economy – and their businesses – are likely to perform in the months and the year ahead (chart below).
The bottom line is that the preponderance of positive surprises this earnings season – coupled with corporations raising estimates nearly across the board – is reflecting a genuine improvement in underlying economic fundamentals. But it also speaks to how corporations are effectively managing their businesses in the current environment and executing their company’s strategic and operating plans. There are always plenty of factors to worry about, like inflation and dislocations in the labor market. But from a pure investment standpoint, it is difficult to argue against business being good.
Bottom Line for Investors
The corporate earnings picture is strong, and the economy is growing at a solid clip. Yet, even still, many want to keep the focus on what’s wrong or ‘will be wrong’ with the economy: inflationary pressures, rising interest rates, frothy asset classes, and bubbles.
Again, I am not saying any of those factors do not matter – they all do. But it’s also important to remember the factor that matters most to stock prices – corporate earnings, in my view – are in a solid place and likely to get stronger. As the wall of worry continues to grow, just remember that corporate earnings are growing too.
In addition to corporate earnings, there are other important data points to keep an eye on. To help you do this, I am offering all readers our Just-Released June 2021 Stock Market Outlook Report.
This report looks at several factors that are producing optimism right now and contains some of our key forecasts to consider such as: If you have $500,000 or more to invest and want to learn more about these forecasts, click on the link below to get your free report today!
Disclosure
2 Zacks Investment Management reserves the right to amend the terms or rescind the free Stock Market Outlook offer at any time and for any reason at its discretion.
3 Zacks Investment Management reserves the right to amend the terms or rescind the free Stock Market Outlook offer at any time and for any reason at its discretion.
DISCLOSURE
Past performance is no guarantee of future results. Inherent in any investment is the potential for loss.
Zacks Investment Management, Inc. is a wholly-owned subsidiary of Zacks Investment Research. Zacks Investment Management is an independent Registered Investment Advisory firm and acts as an investment manager for individuals and institutions. Zacks Investment Research is a provider of earnings data and other financial data to institutions and to individuals.
This material is being provided for informational purposes only and nothing herein constitutes investment, legal, accounting or tax advice, or a recommendation to buy, sell or hold a security. Do not act or rely upon the information and advice given in this publication without seeking the services of competent and professional legal, tax, or accounting counsel. Publication and distribution of this article is not intended to create, and the information contained herein does not constitute, an attorney-client relationship. No recommendation or advice is being given as to whether any investment or strategy is suitable for a particular investor. It should not be assumed that any investments in securities, companies, sectors or markets identified and described were or will be profitable. All information is current as of the date of herein and is subject to change without notice. Any views or opinions expressed may not reflect those of the firm as a whole.
Any projections, targets, or estimates in this report are forward looking statements and are based on the firm’s research, analysis, and assumptions. Due to rapidly changing market conditions and the complexity of investment decisions, supplemental information and other sources may be required to make informed investment decisions based on your individual investment objectives and suitability specifications. All expressions of opinions are subject to change without notice. Clients should seek financial advice regarding the appropriateness of investing in any security or investment strategy discussed in this presentation.
Certain economic and market information contained herein has been obtained from published sources prepared by other parties. Zacks Investment Management does not assume any responsibility for the accuracy or completeness of such information. Further, no third party has assumed responsibility for independently verifying the information contained herein and accordingly no such persons make any representations with respect to the accuracy, completeness or reasonableness of the information provided herein. Unless otherwise indicated, market analysis and conclusions are based upon opinions or assumptions that Zacks Investment Management considers to be reasonable. Any investment inherently involves a high degree of risk, beyond any specific risks discussed herein.
The S&P 500 Index is a well-known, unmanaged index of the prices of 500 large-company common stocks, mainly blue-chip stocks, selected by Standard & Poor’s. The S&P 500 Index assumes reinvestment of dividends but does not reflect advisory fees. The volatility of the benchmark may be materially different from the individual performance obtained by a specific investor. An investor cannot invest directly in an index.
The Russell 1000 Growth Index is a well-known, unmanaged index of the prices of 1000 large-company growth common stocks selected by Russell. The Russell 1000 Growth Index assumes reinvestment of dividends but does not reflect advisory fees. An investor cannot invest directly in an index. The volatility of the benchmark may be materially different from the individual performance obtained by a specific investor.
Nasdaq Composite Index is the market capitalization-weighted index of over 3,300 common equities listed on the Nasdaq stock exchange. The types of securities in the index include American depositary receipts, common stocks, real estate investment trusts (REITs) and tracking stocks, as well as limited partnership interests. The index includes all Nasdaq-listed stocks that are not derivatives, preferred shares, funds, exchange-traded funds (ETFs) or debenture securities. An investor cannot invest directly in an index. The volatility of the benchmark may be materially different from the individual performance obtained by a specific investor.
The Dow Jones Industrial Average measures the daily stock market movements of 30 U.S. publicly-traded companies listed on the NASDAQ or the New York Stock Exchange (NYSE). The 30 publicly-owned companies are considered leaders in the United States economy. An investor cannot directly invest in an index. The volatility of the benchmark may be materially different from the individual performance obtained by a specific investor.