The stock market has not responded well to indications that the U.S.–China trade dispute is falling off course. I’ve written many times that Fed policy, corporate earnings, and the China trade deal would be three key drivers of market returns in 2019, and it follows that bad news on any of those three fronts is likely to make the market wobbly.
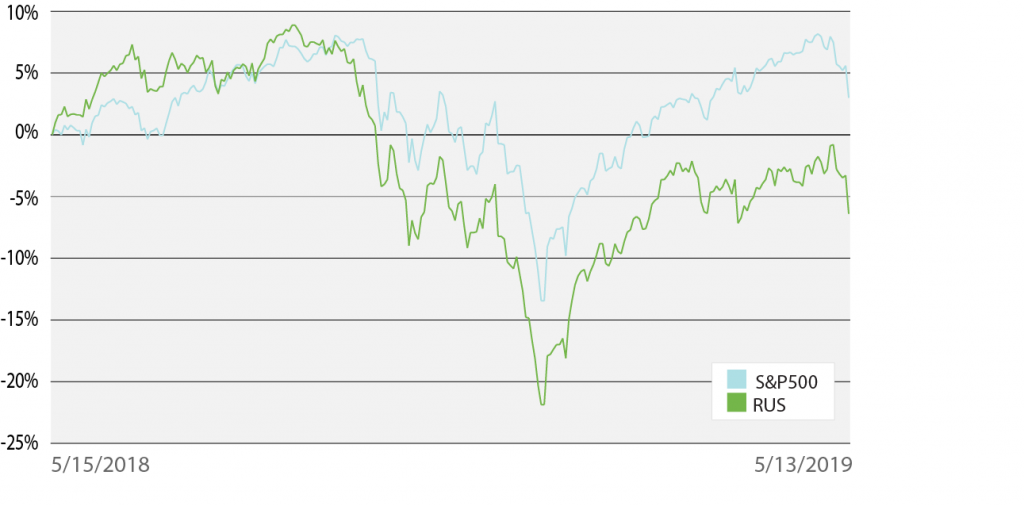
But as investors shed risk assets in light of new tariffs and the possibility of a trade impasse, small-cap stocks have quietly been in a flattish, even slightly negative trend over the past year. Without much fanfare at all, small-caps (as measured by the Russell 2000) in late March of this year were still down more than -10% from all-time highs reached in August of 2018.1 At the same time, the S&P 500 was just a few days away from reaching a new all-time high.
______________________________________________________________________________
Should You Remove Small-Cap Exposure from Your Portfolio?
Small caps negative trend can tempt investors to try and
time when to favor small-caps versus mid-caps versus large-caps. In times like these, I think it is best to stick
to hard data and a well-diversified portfolio. To help you do this, we are offering all readers a first look
into our just-released June 2019 Stock Market Outlook report.
This report will provide you with our forecasts
along with additional factors to consider:
- Should you keep a bullish outlook for 2019?
- What about yield curve inversion?
- What sectors show the best opportunity?
- What industries within those sectors most merit your attention?
- What do we see for leading U.S. economic indicators (LEIs)?
- Small-cap vs. large-cap returns
- And much more.
If you have $500,000 or more to invest and want to learn more about these forecasts, click on the link below to get your free report today!
IT’S FREE. Download the Just-Released Stock Market Outlook2
______________________________________________________________________________
So, what’s been keeping pressure on small-caps?
To understand the answer, one must first understand how small-caps tend to behave in general. Small-cap companies are, generally speaking, domestically-based with fairly low international exposure. They’re also companies with higher risk/reward characteristics, since they (again, generally speaking) have the ability to post faster growth rates than a huge, multinational corporation. That being said, small-caps also tend to hold more debt relative to cash and revenues, and they’re highly sensitive to growth in the broader economy.
Readers might catch two takeaways here:
- If small-caps tend to be domestic companies with less exposure to foreign countries, wouldn’t a trade war with China help boost domestic sales?
- If we’re really in the late innings of this economic expansion, are investors maybe pivoting to larger cap companies with more stable earnings, lower debt, and more cash?
While I think both takeaways are true statements, I think it’s the second one that matters more. And that’s arguably what’s holding small-caps back today.
If you take a look again at the chart above, you’ll notice that small-caps reached a higher all-time high than the S&P 500, but also endured a larger correction during the Q4 sell-off. In my view, such a pattern is totally normal, with small-caps experiencing bigger swings and higher levels of volatility than large-cap stocks. Par for the course.
But keen observers might notice a slight shift in the pattern, beginning in March. When we think of the broad market in Q1 and even through April, we tend to think of it in terms of the strong rally off the bottom. And while small-caps did experience a strong bounce in January and February, you’ll notice that from the beginning of March through today that small-caps have struggled to push higher, instead tracking sideways and even slightly negative. This may be a signal that investors are increasingly determined to favor larger cap companies as the economic growth picture softens with time.
Bottom Line for Investors
Does this mean it’s time to remove small-cap exposure from portfolios? I would say no. For one, small-caps could very well defy the recent trend and shoot higher in the next few quarters. After all, our base case is still for growth in the U.S. economy and the world, even if we expect it to be modest.
Secondly, for investors who have investment objectives that make it suitable to own small-cap stocks, they can be a valuable piece of a diversified portfolio. Since the market low in March 2009, you can see that small-caps have been just as valuable – if not more valuable – to investors with a diversified approach.
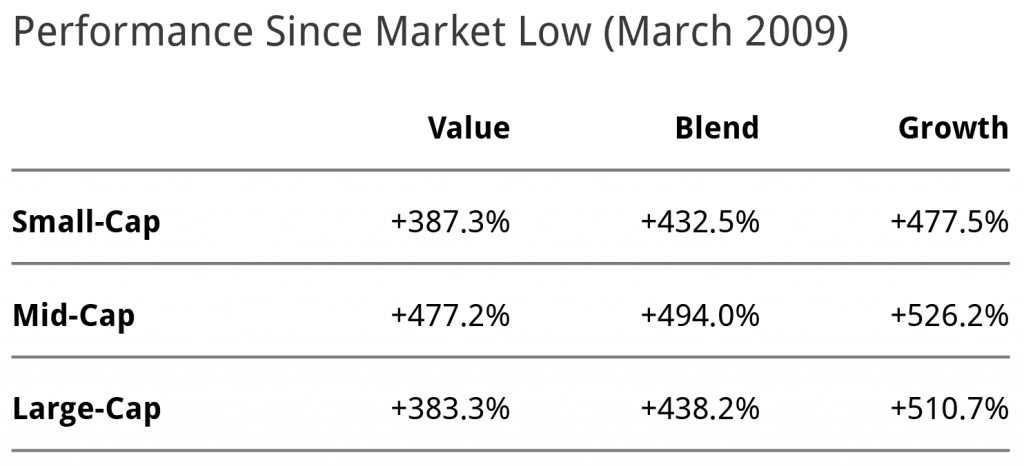
Source: J.P. Morgan3
I would argue that instead of trying to time when to favor small-caps versus mid-caps versus large-caps, building a diversified equity portfolio with exposure to each category can produce the desired results with more control for risk.
Staying
focused on the entire market picture is a great way to avoid this temptation of
trying to time when to favor small-caps. To help you stay focused these
fundamentals and market updates, we are offering all readers a first-look into our
just-released June 2019 Stock Market Outlook report.
This report will provide you with our forecasts
along with additional factors to consider:
- Should you keep a bullish outlook for 2019?
- What about yield curve inversion?
- What sectors show the best opportunity?
- What industries within those sectors most merit your attention?
- What do we see for leading U.S. economic indicators (LEIs)?
- Small-cap vs. large-cap returns
- And much more.
If you have $500,000 or more to invest and want to learn more about these forecasts, click on the link below to get your free report today!4
Disclosure
2 Zacks Investment Management reserves the right to amend the terms or rescind the free Stock Market Outlook offer at any time and for any reason at its discretion.
3 This illustrates market returns of the S & P 500 index. All calculations are cumulative total return. J.P. Morgan, April 30, 2019, https://am.jpmorgan.com/us/en/asset-management/gim/adv/insights/guide-to-the-markets/viewer
4 Zacks Investment Management reserves the right to amend the terms or rescind the free Stock Market Outlook offer at any time and for any reason at its discretion.
DISCLOSURE
Past performance is no guarantee of future results. Inherent in any investment is the potential for loss.
Zacks Investment Management, Inc. is a wholly-owned subsidiary of Zacks Investment Research. Zacks Investment Management is an independent Registered Investment Advisory firm and acts as an investment manager for individuals and institutions. Zacks Investment Research is a provider of earnings data and other financial data to institutions and to individuals.
This material is being provided for informational purposes only and nothing herein constitutes investment, legal, accounting or tax advice, or a recommendation to buy, sell or hold a security. Do not act or rely upon the information and advice given in this publication without seeking the services of competent and professional legal, tax, or accounting counsel. Publication and distribution of this article is not intended to create, and the information contained herein does not constitute, an attorney-client relationship. No recommendation or advice is being given as to whether any investment or strategy is suitable for a particular investor. It should not be assumed that any investments in securities, companies, sectors or markets identified and described were or will be profitable. All information is current as of the date of herein and is subject to change without notice. Any views or opinions expressed may not reflect those of the firm as a whole.
Any projections, targets, or estimates in this report are forward looking statements and are based on the firm’s research, analysis, and assumptions. Due to rapidly changing market conditions and the complexity of investment decisions, supplemental information and other sources may be required to make informed investment decisions based on your individual investment objectives and suitability specifications. All expressions of opinions are subject to change without notice. Clients should seek financial advice regarding the appropriateness of investing in any security or investment strategy discussed in this presentation.
Certain economic and market information contained herein has been obtained from published sources prepared by other parties. Zacks Investment Management does not assume any responsibility for the accuracy or completeness of such information. Further, no third party has assumed responsibility for independently verifying the information contained herein and accordingly no such persons make any representations with respect to the accuracy, completeness or reasonableness of the information provided herein. Unless otherwise indicated, market analysis and conclusions are based upon opinions or assumptions that Zacks Investment Management considers to be reasonable. Any investment inherently involves a high degree of risk, beyond any specific risks discussed herein.
It is not possible to invest directly in an index. Investors pursuing a strategy similar to an index may experience higher or lower returns, which will be reduced by fees and expenses.
The S&P 500 Index is a well-known, unmanaged index of the prices of 500 large-company common stocks, mainly blue-chip stocks, selected by Standard & Poor’s. The S&P 500 Index assumes reinvestment of dividends but does not reflect advisory fees. The volatility of the benchmark may be materially different from the individual performance obtained by a specific investor. An investor cannot invest directly in an index.
The Russell 2000 Index is a well-known, unmanaged index of the prices of 2000 small-cap company common stocks, selected by Russell. The Russell 2000 Index assumes reinvestment of dividends but does not reflect advisory fees. An investor cannot invest directly in an index. The volatility of the benchmark may be materially different from the individual performance obtained by a specific investor.