What Recession Indicators are Telling Us
Investors were legitimately spooked in March, as a few of the most influential recession indicators were flashing SLOWDOWN.
1) The Yield Curve:
With the exception of a single instance, an inverted yield curve has preceded each U.S. recession in the last 50 years. On March 22, the yield curve inverted for the first time since mid-2007 (which, we needn’t remind investors, was just before the biggest recession in a generation.)1
This most recent yield curve inversion was likely the result of a few factors, from the Fed’s 2018 interest rate increases, to low inflation expectations (based on slowing global growth), to investors seeking out U.S. Treasuries as safe havens and as sources of yield, particularly as Brexit woes continue and German bond yields recently turned negative. In fact, I would argue that the European Central Bank’s continued efforts to stimulate the European economy has played a not-insignificant in the current state of the US yield curve.
Even still, as you can see from the chart below, the yield curve has been flattening over several years, arguably as the expansion loses steam and as an inevitable end to the business cycle approaches:
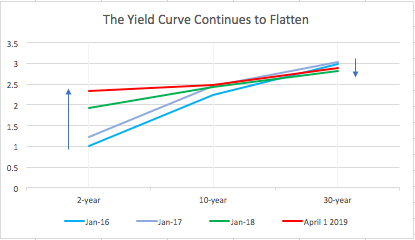
Source: U.S. Department of the Treasury
On balance, however, it’s also important for readers to note that an inverted yield curve does not always result in a recession, and we believe the current yield curve inversion looks more like a “U-shaped” curve (see red line in the chart) than an inverted one, which distinguishes it even further from ‘traditionally’ inverted yield curves of the past.
_____________________________________________________________________________
Are You Prepared for a Potential Recession?
When preparing your investments for a potential recession, it is important to keep an eye on key economic indicators like the yield curve. To help you do this, we are offering all readers a first-look into our just-released April 2019 Stock Market Outlook report.
This report will provide you with our forecasts along with additional factors to consider:
- For how long will 2019 stay bullish?
- Zacks global markets’ outlook
- What sectors show the best opportunity?
- What industries within those sectors most merit your attention?
- Forecast for the S&P
- Small-cap vs. large-cap returns
- And much more.
If you have $500,000 or more to invest and want to learn more about these forecasts, click on the link below to get your free report today!
IT’S FREE. Download the Just-Released April 2019 Stock Market Outlook2
________________________________________________________________________
2) U.S. Corporate Earnings:
With earnings growth expectations for Q1 2019 already in negative territory, and estimates for Q2 2019 moving in that direction as well, there is growing talk of an impending earnings recession.
Earnings worries are coming at a time when many market participants are already wondering whether the current economic cycle can in fact become the longest in U.S. history, a milestone that could be reached later this summer. Earnings estimates have sown doubt on that possibility, as the chart below shows3:
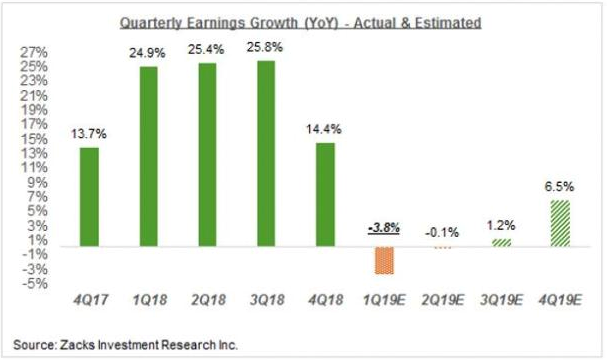
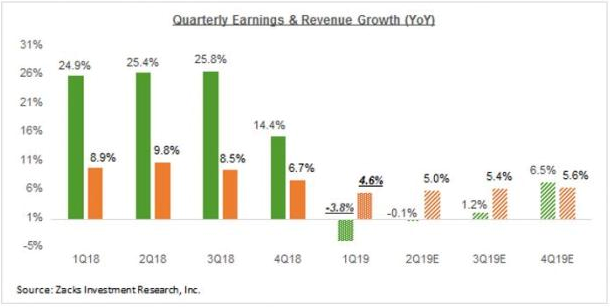
To be fair, the baseline comparison for earnings this quarter are the Q1 2018 earnings that received a major boost from lower corporate tax rates. Perhaps a fairer comparison and/or measure of corporate health would be to look at revenue growth versus earnings growth, which when done shows that the corporate earnings “recession” may not actually be one after all. Even still, negative earnings growth can weigh on investor sentiment, which could ultimately matter to stock prices.
Revenue Growth Hasn’t Dropped Off Meaningfully
3) Leading Economic Indicators:
The Leading Economic Index for the United States compiled by the Federal Reserve Bank of Philadelphia has been a reliable recession indicator for decades. The index measures data from state-level housing permits, state initial unemployment insurance claims, delivery times from the Institute for Supply Management (ISM) manufacturing survey, and the interest rate spread between the 10-year Treasury bond and the 3-month Treasury bill, among other factors. As you can see below, most of the time when the Leading Index dips below 1%, a recession has followed shortly thereafter. While the Leading Index is currently above 1%, it’s also plain to see that it may have peaked in 2014 and is now drifting downward4:
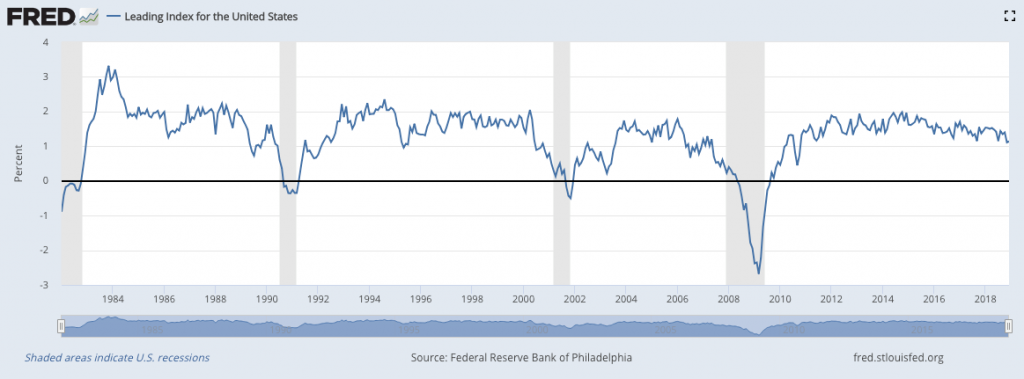
Source: Federal Reserve Bank of St. Louis
On balance, however, it’s important for readers and investors to note that at the end of the day, the stock market historically remains one of the best leading indicators of the economy. The key in terms of the market’s movement relative to economic data is not whether the economic outlook is positive or negative, but rather whether the economic expectations already being priced into the market are met or exceeded. In my view, the market rallied during Q1 2019 not because the economic data was tremendously positive, but rather because the data was not as negative as the market was expecting at the end of 2018.
Bottom Line for Investors
I would take the recent strength in the market to indicate that the likelihood of a bad or disruptive Brexit and the potential for an increase in the magnitude of a trade war – both of which would weigh negatively on earnings materializing – are much less likely to materialize than previously believed. At the start of 2019, most of these fears – Brexit, trade war, etc. – arguably faded and dwindled, while valuations became more attractive with the sell-off. The end result were expectations being reset and investors realizing that equities were all of a sudden attractive again.
There’s reason to believe positive sentiment towards equities could continue, as well. Policy makers in the U.S., Europe, and China appear to be tuned into the signals being given by the various indicators, as the Federal Reserve has essentially stopped its gradual interest rate increases, the European Central Bank has eased monetary policy, and China has engaged in fiscal stimulus in both forms – cutting taxes and increasing spending.
The next phase for investors will be to watch each indicator closely in the next quarter or two, and also to see if any of these monetary and fiscal efforts may shift market expectations about prolonging the expansion.
To help you keep an eye on these indicators along with economic data releases, earnings reports, and other economic factors, I am offering all readers our Just-Released April 2019 Stock Market Outlook Report.
This Special Report is packed with newly revised predictions that can help you base your next investment move on hard data. For example, you’ll discover Zacks’ view on:
- For how long will 2019 stay bullish?
- Zacks global markets’ outlook
- What sectors show the best opportunity?
- What industries within those sectors most merit your attention?
- Forecast for the S&P
- Small-cap vs. large-cap returns
- And much more.
If you have $500,000 or more to invest and want to learn more about these forecasts, click on the link below to get your free report today! FREE Download – Zacks’ April 2019 Stock Market Outlook5
Disclosure
2 Zacks Investment Management reserves the right to amend the terms or rescind the free Stock Market Outlook offer at any time and for any reason at its discretion.
3 Zacks.com, March 20, 2019. https://www.zacks.com/commentary/362428/weak-earnings-growth-ahead
4 Federal Reserve Bank of St. Louis, March 11, 2019. https://fred.stlouisfed.org/series/USSLIND
5 Zacks Investment Management reserves the right to amend the terms or rescind the free Stock Market Outlook offer at any time and for any reason at its discretion.
DISCLOSURE
Past performance is no guarantee of future results. Inherent in any investment is the potential for loss.
Zacks Investment Management, Inc. is a wholly-owned subsidiary of Zacks Investment Research. Zacks Investment Management is an independent Registered Investment Advisory firm and acts as an investment manager for individuals and institutions. Zacks Investment Research is a provider of earnings data and other financial data to institutions and to individuals.
This material is being provided for informational purposes only and nothing herein constitutes investment, legal, accounting or tax advice, or a recommendation to buy, sell or hold a security. Do not act or rely upon the information and advice given in this publication without seeking the services of competent and professional legal, tax, or accounting counsel. Publication and distribution of this article is not intended to create, and the information contained herein does not constitute, an attorney-client relationship. No recommendation or advice is being given as to whether any investment or strategy is suitable for a particular investor. It should not be assumed that any investments in securities, companies, sectors or markets identified and described were or will be profitable. All information is current as of the date of herein and is subject to change without notice. Any views or opinions expressed may not reflect those of the firm as a whole.
Any projections, targets, or estimates in this report are forward looking statements and are based on the firm’s research, analysis, and assumptions. Due to rapidly changing market conditions and the complexity of investment decisions, supplemental information and other sources may be required to make informed investment decisions based on your individual investment objectives and suitability specifications. All expressions of opinions are subject to change without notice. Clients should seek financial advice regarding the appropriateness of investing in any security or investment strategy discussed in this presentation.
Certain economic and market information contained herein has been obtained from published sources prepared by other parties. Zacks Investment Management does not assume any responsibility for the accuracy or completeness of such information. Further, no third party has assumed responsibility for independently verifying the information contained herein and accordingly no such persons make any representations with respect to the accuracy, completeness or reasonableness of the information provided herein. Unless otherwise indicated, market analysis and conclusions are based upon opinions or assumptions that Zacks Investment Management considers to be reasonable. Any investment inherently involves a high degree of risk, beyond any specific risks discussed herein.
It is not possible to invest directly in an index. Investors pursuing a strategy similar to an index may experience higher or lower returns, which will be reduced by fees and expenses.