The Nobel laureate economist, Robert Shiller, recently penned an article in The New York Times warning, amongst other things, that market valuations (as measured by the CAPE ratio) were at levels not seen since 1929 and 1999.1 Market historians would note that 1929 and 1999 preceded weak decades for market returns, with the Great Depression on the one hand and the Tech Bubble and Great Recession on the other.
With the start of a new decade in 2020 and the historically high CAPE ratio, it begs the question: are we in year one of a weak decade for stocks?
First, an Understanding of How the CAPE Ratio Works
A good starting point for understanding the CAPE ratio is to think about the basic P/E ratio first. The P/E (price to earnings) ratio measures a stock’s price relative to its per-share earnings over the last year. It is a widely-accepted metric for valuation, but Shiller and fellow economist John Y. Campbell saw a problem with it.
They recognized that a company’s earnings can be fairly volatile from year to year, and that earnings volatility is especially true during peak and trough years in a business cycle. So, to minimize the effect of short-term business cycle gyrations on the valuation measure, the two economists created a ratio where the stock price is divided by the company’s average earnings over the previous 10 years, instead of just a single year. This helps “smooth” out the number and allows for comparing valuations over a longer time horizon.
A high CAPE ratio signals an overvalued market, and Shiller notes that the current CAPE ratio (31) has only been higher twice in history: 1929 and 1999. The S&P 500 fell some -85% through 1932 and -50% in the 2000 bear market.2
_____________________________________________________________________
Does this Mean a Bear Market is Around the Corner?
The CAPE ratio is only one factor to consider. Instead of letting one indicator make you fearful of a bear market, I recommend focusing on the whole picture. In addition to the CAPE ratio, it is important to keep an eye on fundamentals, earnings, growth, innovation and other key economic indicators, in my view. To help you do this, we are offering all readers a look into our just-released February 2020 Stock Market Outlook report.
This report will provide you with our forecasts along with additional factors to consider:
- U.S. returns expectations for 2020
- What Produces 2020 Optimism?
- What of U.S. GDP Growth?
- Is it time to buy U.S. stocks in January?
- Will the “U.S. China Trade War” remain a stumbling block in 2020?
- Small-cap vs. large-cap returns
- And much more.
If you have $500,000 or more to invest and want to learn more about these forecasts, click on the link below to get your free report today!
IT’S FREE. Download the Just-Released February 2020 Stock Market Outlook3
_____________________________________________________________________
Ready to Run for the Exits? Not So Fast.
The CAPE ratio is a useful indicator and has plenty of merits. But in my view, making investment decisions based solely on CAPE ratio levels is flawed, if not outright wrong.
For one, the CAPE ratio uses decade-old earnings data, which is great for historical comparisons but tells us virtually nothing about what lies ahead (which is exactly what we want to inform our investment decisions). Factors like falling energy prices, cheaper commodities, productivity gains, currency fluctuations, and powerful new technologies and innovations (just to name a few) are likely to contribute significantly – or conversely weigh down – a company’s future earnings, in my view.
Remember, a stock’s price today is greatly influenced by what investors are willing to pay for expected earnings, meaning that sentiment, growth forecasts, innovation, and management play key roles. The CAPE ratio doesn’t account for any of these things.
Another reason I believe investors should not rely only on CAPE ratios to make investment decisions: doing so would have likely meant missing out on big gains in this bull market.
In 2013, The Wall Street Journal wrote of a “rising concern among some market watchers that stocks are being lifted by a potentially dangerous bubble, with Shiller’s index seen as one of the early warning signs.”4 In 2016, The Wall Street Journal published an article titled, “Stock Valuations Flash a Warning Sign” when the CAPE ratio rose above 27. In that article, readers were reminded that when the CAPE ratio reaches it top decile, the S&P 500 averages about 4% annually for the following ten years.5
Either of these articles – or the dozens of others that cited warning signs for the CAPE ratio over the last decade – could make a theoretically compelling case for investors to pare down equity exposure. But the chart below illustrates quite clearly why I believe it would not have made good investment sense to do so.
In Spite of CAPE Ratio Warnings, the S&P 500 has Continued to Climb
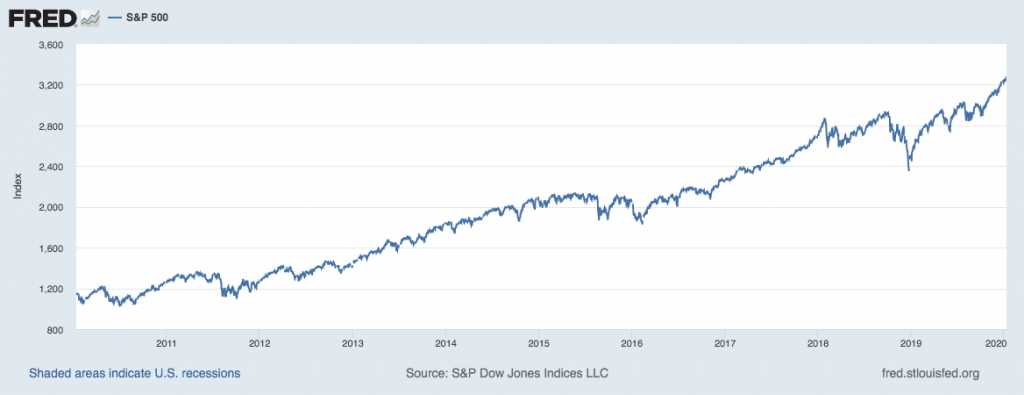
Source: Federal Reserve Bank of St. Louis6
Bottom Line for Investors
Investors are constantly searching for ways to ‘value’ the market. Valuations help us determine when stocks are cheap and therefore attractive, or when they’re expensive and should be avoided. But valuations alone should not direct an investment strategy. If they did, and you relied on the CAPE metric as a proxy for when to invest in the last twenty years, you may have never owned equities! For a long-term growth investor, that would have been a mistake, in my view.
If today we saw a confluence of negative economic data alongside a high and rising CAPE ratio, then we’d probably have something to fear. But we don’t think that’s the case at all.
Global growth is expected to hit close to 3% in 2020, interest rates remain low globally, inflation is low and controlled in the U.S., the labor market is strong as ever, and corporate profits are expected to post strong growth following weak comparisons in 2019. The CAPE ratio may signal trouble in the decade ahead, but at the end of the day (and decade), I believe it is fundamentals, earnings, growth, and innovation that will determine the market outcome.
To help you get a deeper insight into these factors and other key economic indicators, check out our Just-Released February 2020 Stock Market Outlook Report.
This Special Report is packed with newly revised predictions to consider for 2020 that can help you base your next investment move on hard data. For example, you’ll discover Zacks’ view on:
- U.S. returns expectations for 2020
- What Produces 2020 Optimism?
- What of U.S. GDP Growth?
- Is it time to buy U.S. stocks in January?
- Will the “U.S. China Trade War” remain a stumbling block in 2020?
- Small-cap vs. large-cap returns
- And much more.
If you have $500,000 or more to invest and want to learn more about these forecasts, click on the link below to get your free report on fundamentals, earnings, growth, and innovation today! 7
Disclosure
2 The New York Times, January 2, 2020. https://www.nytimes.com/2020/01/02/business/gut-feelings-are-driving-the-markets.html
3 Zacks Investment Management reserves the right to amend the terms or rescind the free Stock Market Outlook offer at any time and for any reason at its discretion.
4 The Wall Street Journal, November 21, 2019. https://www.wsj.com/articles/shiller8217s-warnings-spark-debate-1385053512
5 The Wall Street Journal, August 14, 2016. https://www.wsj.com/articles/stock-valuations-flash-a-warning-sign-1471189314
6 S&P Dow Jones Indices LLC, S&P 500 [SP500], retrieved from FRED, Federal Reserve Bank of St. Louis; https://fred.stlouisfed.org/series/SP500, January 14, 2020.
7 Zacks Investment Management reserves the right to amend the terms or rescind the free Stock Market Outlook offer at any time and for any reason at its discretion.
DISCLOSURE
Past performance is no guarantee of future results. Inherent in any investment is the potential for loss.
Zacks Investment Management, Inc. is a wholly-owned subsidiary of Zacks Investment Research. Zacks Investment Management is an independent Registered Investment Advisory firm and acts as an investment manager for individuals and institutions. Zacks Investment Research is a provider of earnings data and other financial data to institutions and to individuals.
This material is being provided for informational purposes only and nothing herein constitutes investment, legal, accounting or tax advice, or a recommendation to buy, sell or hold a security. Do not act or rely upon the information and advice given in this publication without seeking the services of competent and professional legal, tax, or accounting counsel. Publication and distribution of this article is not intended to create, and the information contained herein does not constitute, an attorney-client relationship. No recommendation or advice is being given as to whether any investment or strategy is suitable for a particular investor. It should not be assumed that any investments in securities, companies, sectors or markets identified and described were or will be profitable. All information is current as of the date of herein and is subject to change without notice. Any views or opinions expressed may not reflect those of the firm as a whole.
Any projections, targets, or estimates in this report are forward looking statements and are based on the firm’s research, analysis, and assumptions. Due to rapidly changing market conditions and the complexity of investment decisions, supplemental information and other sources may be required to make informed investment decisions based on your individual investment objectives and suitability specifications. All expressions of opinions are subject to change without notice. Clients should seek financial advice regarding the appropriateness of investing in any security or investment strategy discussed in this presentation.
Certain economic and market information contained herein has been obtained from published sources prepared by other parties. Zacks Investment Management does not assume any responsibility for the accuracy or completeness of such information. Further, no third party has assumed responsibility for independently verifying the information contained herein and accordingly no such persons make any representations with respect to the accuracy, completeness or reasonableness of the information provided herein. Unless otherwise indicated, market analysis and conclusions are based upon opinions or assumptions that Zacks Investment Management considers to be reasonable. Any investment inherently involves a high degree of risk, beyond any specific risks discussed herein.