Many readers have probably seen this stat-line before: U.S. consumer spending accounts for roughly two-thirds of total GDP.1 With U.S. GDP crossing $20 trillion in 2019, that means the consumer doled out approximately $13 trillion last year. As a category, that makes the U.S. consumer nearly as big as the entire Chinese economy (~$14 trillion) and is almost three times bigger than Japan’s economy (~$5 trillion).
The United States has exponentially more spending power than any other country in the world, and investors shouldn’t underestimate the U.S. consumer’s ability to drive the recovery forward.
To be fair, quite a lot hinges on people being able to return to work in the coming weeks and months, and it may take years for the labor market to fully recover. But early data indicates that federal stimulus programs – coupled with some pent-up demand established during the lockdown – have led to a stronger rebound in consumer spending than almost everyone anticipated.
________________________________________________________________________
Hard Data & Economic Indicators You Should Keep an Eye On!
In addition to consumer spending data, there are additional data points and economic indicators that you should pay attention to in this turbulent time. To help you focus on the hard data and other factors that could impact your investments, I am offering all readers our just-released Stock Market Outlook report. This report contains some of our key forecasts to consider such as:
- The economic effects of the COVID-19 pandemic
- U.S. returns expectations for 2020
- Background on the U.S. fiscal stimulus program
- Why you should be careful in determining what S&P 500 data to use
- Zacks Rank S&P 500 Sector Picks
- Status of global energy markets
- What produces 2020 optimism?
- And much more
If you have $500,000 or more to invest and want to learn more about these forecasts, click on the link below to get your free report today!
IT’S FREE. Download the Just-Released July 2020 Stock Market Outlook2
__________________________________________________________________________
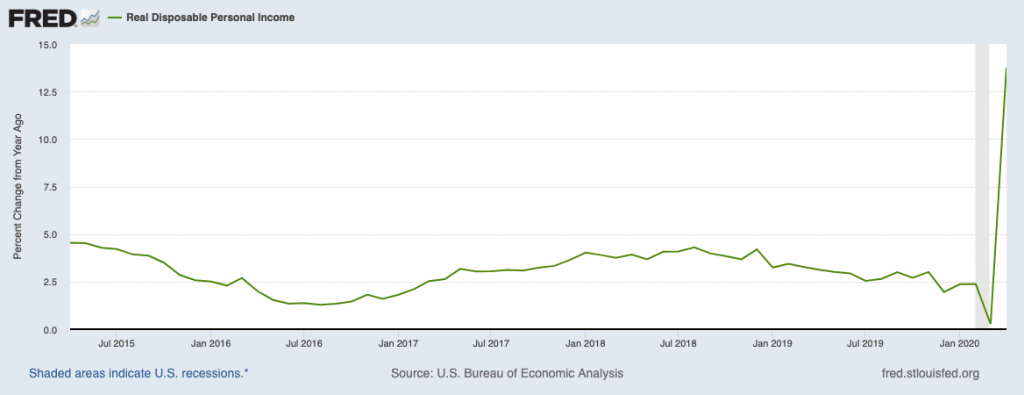
It may be difficult to fathom, but real personal incomes in America actually went up during the month of April (14% year-over-year), as IRS payments and super-charged unemployment benefits hit millions of mailboxes and bank accounts.
Real Personal Income Jumped in April
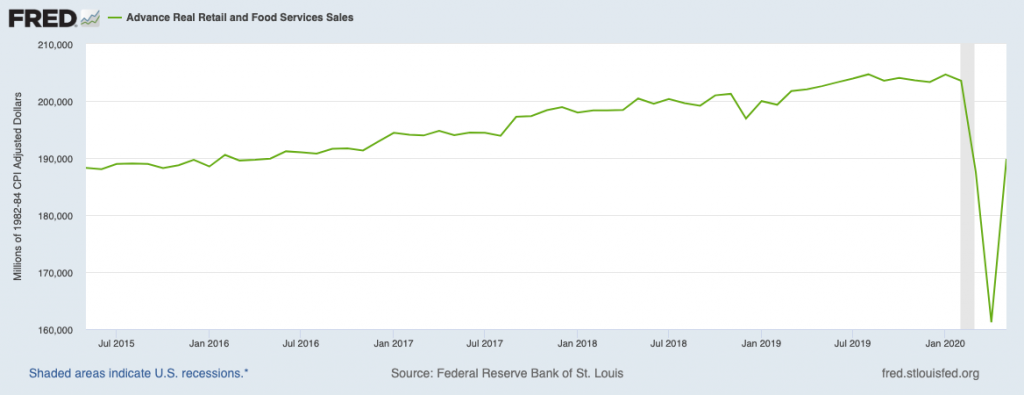
This income boost is temporary, of course, but it’s proven to be effective. Advance real retail and food services sales saw a jump in April and May, creating a “v-shaped” bounce from the record lows experienced during lockdowns. A significant portion of spending came from online shopping, accelerating a trend to e-commerce that has been underway for years now. Walmart’s online sales soared +74% in the first quarter, posting its highest sales growth on record in e-commerce. Amazon enjoyed a similar tailwind, with net sales from online shopping hitting $36.7 in Q1 – a +25% year-over-year increase.4
The Consumer’s Pent-Up Demand + Stimulus Payments Boosting Spending
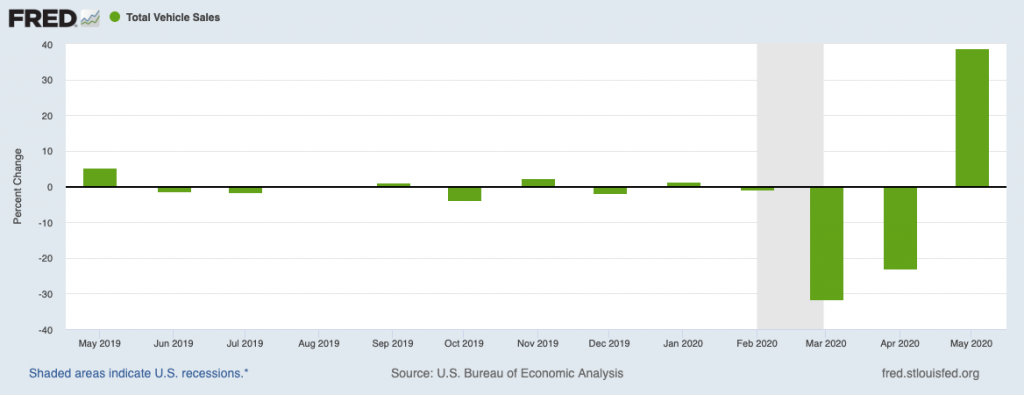
Other spending categories are seeing signs of life again as well. Pending home sales in April were brutal, with figures falling 34% from a year earlier. But according to the National Association of Realtors, a seasonally adjusted measure of home-buying demand was up +16.5% by mid-May, and mortgage applications have been climbing every week since May. With the U.S. 30-year fixed mortgage rate averaging 3.15%, it’s as good a time as any to finance.6 Auto sales also rebounded strongly in May, coming off record-setting declines in March and April:
Auto Sales Saw a Strong Rebound in May
Finally, I think it’s important to acknowledge that going into this crisis, the U.S. consumer was in far better shape as compared to household finances before and during the 2008 financial crisis. Starting in the early 1990’s, households in America have been seeing rising debt payments as a percent of disposable personal income. In other words, an increasing share of Americans’ paychecks were going towards paying off debt. In the aftermath of the financial crisis, however, debt payments as a percent of income have plummeted, putting households in a better position to recover more quickly this time around.
Household Finances Have Improved Over the Last 10 Years

Bottom Line for Investors
Does all this mean that the U.S. consumer is poised to rescue the economy and bring back strong growth? Not necessarily. As mentioned before, quite a bit hinges on how quickly people can return to work and also on how much longer fiscal stimulus will last – the extra unemployment benefit is currently set to expire on July 31, and Congress and the White House are mulling another stimulus. Time will tell, but I wouldn’t underestimate the U.S. consumer.
In addition to consumer spending, there are other data points and economic fundamentals that you should keep an eye on. To help you focus on the hard data, I am offering all readers our Just-Released July 2020 Stock Market Outlook Report.
This Special Report is packed with newly revised predictions that can help you base your next investment move on hard data. For example, you’ll discover Zacks’ view on:
- The economic effects of the COVID-19 pandemic
- U.S. returns expectations for 2020
- Background on the U.S. fiscal stimulus program
- Why you should be careful in determining what S&P 500 data to use
- Zacks Rank S&P 500 Sector Picks
- Status of global energy markets
- What produces 2020 optimism?
- And much more
If you have $500,000 or more to invest and want to learn more about these forecasts, click on the link below to get your free report today!3
Disclosure
2 Zacks Investment Management reserves the right to amend the terms or rescind the free Stock Market Outlook offer at any time and for any reason at its discretion.
3 U.S. Bureau of Economic Analysis, Real Disposable Personal Income [DSPIC96], retrieved from FRED, Federal Reserve Bank of St. Louis; https://fred.stlouisfed.org/series/DSPIC96, June 23, 2020.
4 BlackRock, June 11, 2020. https://www.blackrockblog.com/2020/06/11/the-u-s-consumer-is-bowed-not-broken/
5 Federal Reserve Bank of St. Louis, Advance Real Retail and Food Services Sales [RRSFS], retrieved from FRED, Federal Reserve Bank of St. Louis; https://fred.stlouisfed.org/series/RRSFS, June 23, 2020.
6 The Wall Street Journal, May 28, 2020. https://www.wsj.com/articles/pending-home-sales-plunge-but-housing-market-shows-signs-of-recovery-11590686143
7 U.S. Bureau of Economic Analysis, Total Vehicle Sales [TOTALSA], retrieved from FRED, Federal Reserve Bank of St. Louis; https://fred.stlouisfed.org/series/TOTALSA, June 23, 2020.
8 Board of Governors of the Federal Reserve System (US), Household Debt Service Payments as a Percent of Disposable Personal Income [TDSP], retrieved from FRED, Federal Reserve Bank of St. Louis; https://fred.stlouisfed.org/series/TDSP, June 23, 2020.
9 Zacks Investment Management reserves the right to amend the terms or rescind the free Stock Market Outlook offer at any time and for any reason at its discretion.
DISCLOSURE
Past performance is no guarantee of future results. Inherent in any investment is the potential for loss.
Zacks Investment Management, Inc. is a wholly-owned subsidiary of Zacks Investment Research. Zacks Investment Management is an independent Registered Investment Advisory firm and acts as an investment manager for individuals and institutions. Zacks Investment Research is a provider of earnings data and other financial data to institutions and to individuals.
This material is being provided for informational purposes only and nothing herein constitutes investment, legal, accounting or tax advice, or a recommendation to buy, sell or hold a security. Do not act or rely upon the information and advice given in this publication without seeking the services of competent and professional legal, tax, or accounting counsel. Publication and distribution of this article is not intended to create, and the information contained herein does not constitute, an attorney-client relationship. No recommendation or advice is being given as to whether any investment or strategy is suitable for a particular investor. It should not be assumed that any investments in securities, companies, sectors or markets identified and described were or will be profitable. All information is current as of the date of herein and is subject to change without notice. Any views or opinions expressed may not reflect those of the firm as a whole.
Any projections, targets, or estimates in this report are forward looking statements and are based on the firm’s research, analysis, and assumptions. Due to rapidly changing market conditions and the complexity of investment decisions, supplemental information and other sources may be required to make informed investment decisions based on your individual investment objectives and suitability specifications. All expressions of opinions are subject to change without notice. Clients should seek financial advice regarding the appropriateness of investing in any security or investment strategy discussed in this presentation.
Certain economic and market information contained herein has been obtained from published sources prepared by other parties. Zacks Investment Management does not assume any responsibility for the accuracy or completeness of such information. Further, no third party has assumed responsibility for independently verifying the information contained herein and accordingly no such persons make any representations with respect to the accuracy, completeness or reasonableness of the information provided herein. Unless otherwise indicated, market analysis and conclusions are based upon opinions or assumptions that Zacks Investment Management considers to be reasonable. Any investment inherently involves a high degree of risk, beyond any specific risks discussed herein.
The S&P 500 Index is a well-known, unmanaged index of the prices of 500 large-company common stocks, mainly blue-chip stocks, selected by Standard & Poor’s. The S&P 500 Index assumes reinvestment of dividends but does not reflect advisory fees. The volatility of the benchmark may be materially different from the individual performance obtained by a specific investor. An investor cannot invest directly in an index.