According to the National Bureau of Economic Research (NBER), the U.S. economy has been growing for over ten years – putting it on the level with the longest expansion period in U.S. history, from March 1991 to March 2001. By the NBER’s measure, just one more month of growth would make this the longest expansion cycle in our country’s history.1
Expansions don’t die of old age, so this historical milestone does not by itself imply that the U.S. is headed for a recession soon. But there’s some recent economic data that seems to be implying a real growth deceleration, with cracks forming in the economy that have some Fed officials voicing concern.
________________________________________________________________________
As the Bull Ages, Base Your Investing Decisions on Hard Data
Trying to time a recession, in my view, is not the best option. Instead, I recommend planning for the long-term. When preparing your investments for a potential recession, it is important to keep an eye on key economic indicators. To help you do this, we are offering all readers a look into our just-released July 2019 Stock Market Outlook report.
This 22-page report contains some of our key forecasts to consider such as:
- Inside the China tariff war
- Why are Zacks strategists (including me) staying bullish?
- Stock market returns expectations for 2019
- Small-cap and large-cap outlook in 2019
- What of cuts in global growth?
- What produces 2019 Optimism?
- And much more.
If you have $500,000 or more to invest and want to learn more about these forecasts, click on the link below to get your free report today!
IT’S FREE. Download the Just-Released July 2019 Stock Market Outlook2
________________________________________________________________________
Below is a detailed look at recession indicators you should keep an eye on:
1) The Yield Curve: Let’s start with the yield curve, which has historically been a reliable indicator of expansions and recessions. Vice Chair of the Federal Reserve Board, Richard Clarida, made the point clear when he stated that “I think historically a flat yield curve doesn’t convey a lot of information. If the yield curve inverts as it has…and if it persists for some time, that’s obviously something I [Clarida] would definitely take seriously.”
When looking at the difference between the 10-year U.S. Treasury and the 3-month T-bill, the yield curve is officially inverted:3
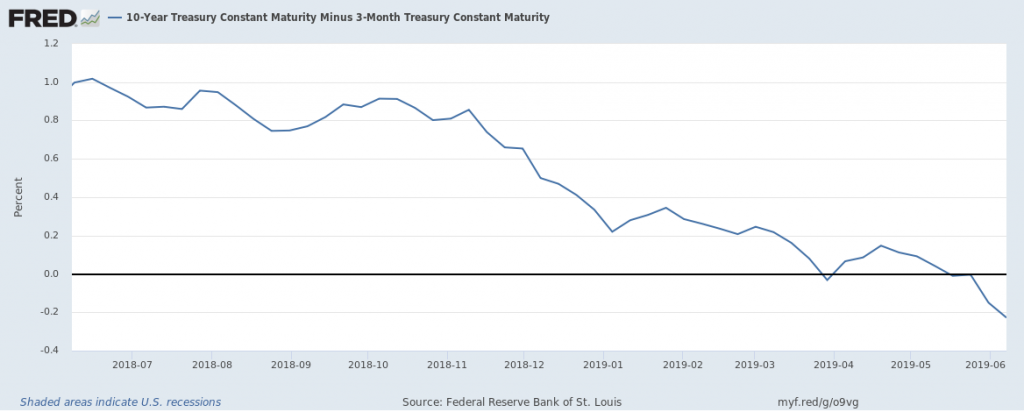
Source: Federal Reserve Bank of St. Louis
We’ll be watching to see if the yield curve stays inverted moving forward. But it’s worth noting that interest rates have been subject to a $4 trillion balance sheet expansion by the Fed as well as extraordinary monetary policies that have kept interest rates artificially low for some time. For these reasons, it’s debatable whether the yield curve indicator may be as reliable in forecasting a recession as in times past (see chart below). Regardless, we’ll need to see if the yield curve remains consistently inverted for some time, and reassess in a few months.
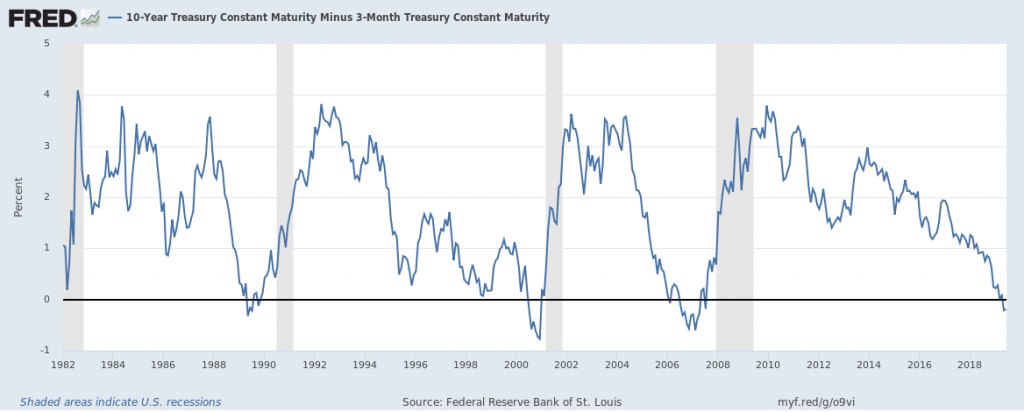
Source: Federal Reserve Bank of St. Louis4
2) The Labor Market: Another indicator to watch closely is the labor market, which some could argue has already reached a peak in its ability to create new job growth. The U.S. Department of Labor’s May employment report showed far weaker job growth than expected, with 75,000 new nonfarm jobs added versus the 175K–180K expected.5 Keen observers would also note that with downward revisions to March and April readings, the net change for May was essentially flat. The economy’s ability to create new jobs or fill existing openings is a key tenet for growth.
3) Transportation: Transportation is another area where signs of weakness are starting to show in the data. The movement of goods across the country by freight or rail is often a good measure of economic activity at-large, and by some measures that activity has turned negative in recent months. One such measure, the Cass Freight Index, measures volume and velocity of goods moving across the United States, and its April report showed negative year-over-year activity over the last five months.6
On balance, we have an economic expansion that is near becoming the longest in U.S. history, and we have economic data showing that the expansion may be losing its legs – not to mention an ongoing trade war between the U.S. and the world’s second largest economy, China. Even if one cannot make the case for a recession in 2019 or soon, it’s at least apparent that the road to accelerating economic growth is uphill (and fairly steep).
Bottom Line for Investors
The Fed’s actions later this month and in July will almost certainly matter to markets, and investors should continue to monitor economic data carefully.
But at the end of the day, investors should also remember that the stock market is arguably the most reliable leading indicator for recessions, often peaking well before the U.S. economy does. By a similar token, the stock market will often begin its recovery a few months before the U.S. economy starts growing again.
Trying to time these peaks and troughs is extraordinarily difficult, as the windows for getting it right are small relative to most investor’s time horizons. Over the last 65 years, the U.S. has been in a recession in less than 15% of all months, and in some of those cases equity returns were positive even over the full length of the contraction (again, since stock market recoveries often start before economic recoveries do). Trying to time the recession perfectly is certainly an option, it just might not be a wise one.
Instead, I recommend staying focused on the long-term and on
key economic indicators. To help you do this, I invite you to download our Just-Released July 2019
Stock Market Outlook Report.
This Special Report is packed with our
newly revised predictions for 2019. For example, you’ll discover Zacks’ view
on:
- Inside the China tariff war
- Why are Zacks strategists (including me) staying bullish?
- Stock market returns expectations for 2019
- Small-cap and large-cap outlook in 2019
- What of cuts in global growth?
- What produces 2019 Optimism?
- And much more.
If you have $500,000 or more to invest, learn how you may be able to prepare your portfolio for changes in the economy by reading this new report today.7
Disclosure
2 Zacks Investment Management reserves the right to amend the terms or rescind the free Stock Market Outlook offer at any time and for any reason at its discretion.
3 Federal Reserve Bank of St. Louis, June 10, 2019. https://fred.stlouisfed.org/series/T10Y3M
4 Federal Reserve Bank of St. Louis, June 10, 2019. https://fred.stlouisfed.org/series/T10Y3M
5 Forbes, June 7, 2019. https://www.forbes.com/sites/chuckjones/2019/06/07/trumps-job-growth-is-the-lowest-since-he-took-office/#103c37f81c09
6 Forbes, May 27, 2019. https://www.forbes.com/sites/chuckjones/2019/05/27/3-charts-show-trumps-economy-is-weaker-than-people-think/#60abc46a6294
7 Zacks Investment Management reserves the right to amend the terms or rescind the free Stock Market Outlook offer at any time and for any reason at its discretion.
DISCLOSURE
Past performance is no guarantee of future results. Inherent in any investment is the potential for loss.
Zacks Investment Management, Inc. is a wholly-owned subsidiary of Zacks Investment Research. Zacks Investment Management is an independent Registered Investment Advisory firm and acts as an investment manager for individuals and institutions. Zacks Investment Research is a provider of earnings data and other financial data to institutions and to individuals.
This material is being provided for informational purposes only and nothing herein constitutes investment, legal, accounting or tax advice, or a recommendation to buy, sell or hold a security. Do not act or rely upon the information and advice given in this publication without seeking the services of competent and professional legal, tax, or accounting counsel. Publication and distribution of this article is not intended to create, and the information contained herein does not constitute, an attorney-client relationship. No recommendation or advice is being given as to whether any investment or strategy is suitable for a particular investor. It should not be assumed that any investments in securities, companies, sectors or markets identified and described were or will be profitable. All information is current as of the date of herein and is subject to change without notice. Any views or opinions expressed may not reflect those of the firm as a whole.
Any projections, targets, or estimates in this report are forward looking statements and are based on the firm’s research, analysis, and assumptions. Due to rapidly changing market conditions and the complexity of investment decisions, supplemental information and other sources may be required to make informed investment decisions based on your individual investment objectives and suitability specifications. All expressions of opinions are subject to change without notice. Clients should seek financial advice regarding the appropriateness of investing in any security or investment strategy discussed in this presentation.
Certain economic and market information contained herein has been obtained from published sources prepared by other parties. Zacks Investment Management does not assume any responsibility for the accuracy or completeness of such information. Further, no third party has assumed responsibility for independently verifying the information contained herein and accordingly no such persons make any representations with respect to the accuracy, completeness or reasonableness of the information provided herein. Unless otherwise indicated, market analysis and conclusions are based upon opinions or assumptions that Zacks Investment Management considers to be reasonable. Any investment inherently involves a high degree of risk, beyond any specific risks discussed herein.
It is not possible to invest directly in an index. Investors pursuing a strategy similar to an index may experience higher or lower returns, which will be reduced by fees and expenses.