According to the Bureau of Economic Analysis, the U.S. economy grew at an annualized rate of 6.5% in the second quarter. Many areas of the economy are still in recovery mode, but for all intents and purposes, the U.S. economy is back to its pre-pandemic size – and we see plenty of runway for growth ahead.
The surge of activity in the first half of 2021 was largely expected and has been great for many households and businesses. Consumer spending persists as the lead driver of the expansion, with spending up 11.8% in the three months ending June 30—the second-best performance since 1952. Business investment also rose 8%, adding 1.1% to the total GDP number.
The drag on U.S. economic growth in the second quarter came from inventory drawdowns, which subtracted 1.1% from GDP, rising imports, and a decrease in federal government spending. According to the Bureau of Economic Analysis, nondefense spending on intermediate goods and services fell the most, largely due to a drop-off in Paycheck Protection Program (PPP) loans.1
__________________________________________________________________________
Have the Economy & Stock Market Returns Peaked?
We are currently witnessing an economic boom right after an extreme collapse due to the 2020 pandemic. But what does this mean for the future? Have stock market returns peaked or is another downturn around the corner?
Get answers to these questions and more with our just-released Stock Market Outlook report. This report contains some of our key forecasts to consider such as:
- Zacks April and May view on equity markets
- A look at the Covid-19 vaccine tracker update
- A look at U.S. returns expectations for 2021
- Zacks Rank S&P 500 Sector Picks
- What produces 2021 optimism?
- Sell-side and buy-side consensus
- And much more
If you have $500,000 or more to invest and want to learn more about these forecasts, click on the link below to get your free report today!
IT’S FREE. Download the Just-Released August 2021 Stock Market Outlook2
__________________________________________________________________________
The return to growth has been welcomed and also positive for the equity markets, in my view. But based on our forecasts here at Zacks Investment Management, the 6.5% Q2 growth rate is likely to be the fastest the U.S. economy will deliver in this cycle. Meaning, we may have just seen ‘peak growth’ in the economy, with spending and GDP expansion set to slow from here. The effect of stimulus payments is fading, there is a low likelihood of another round of direct transfers (fiscal stimulus), and the U.S. economy looks poised to settle into a more modest, sustainable rate of growth:
Federal Reserve GDP Growth Estimates 2021 – 2023 (Median)
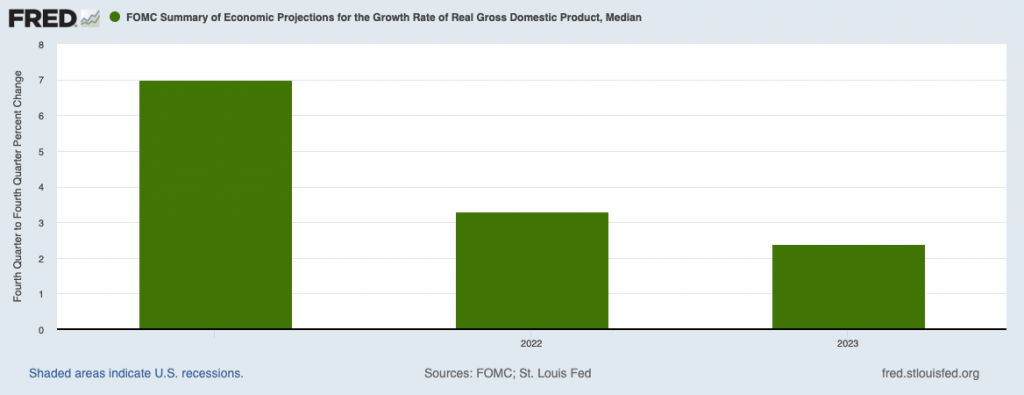
The moderating pace of GDP growth has some investors worried. If the economy has peaked, does it mean stock returns may have peaked, too?
I think the answer is no – and history suggests it is, too. Take the period from 1995 to 1999, for example. Most readers remember this as a period of high-flying growth, thanks to the blooming age of the internet. Over those four years, the U.S. economy was averaging over 4% GDP growth – quite strong. The weakest growth year in that period was 1995 when the U.S. economy ‘only’ expanded 2.7%. But the weakest GDP growth year also delivered the strongest year for stock returns, with the S&P 500 rising over +35%. The stock market may have been discounting the strong growth years that would follow, granted, but who is to say 2022 and 2023 will not be better-than-expected growth years?
One more example to offer some additional context. From 2009 to 2019, the U.S. economy averaged just 1.9% of GDP growth, which was about half the growth rate it averaged over the previous 20 years. Historically speaking, this was considered weak growth. But there was not a noticeably adverse impact for S&P 500 returns—from 2009 to 2019, the index rose +351%!4 The third-weakest year in the stretch, 2013, was also the best year for stocks in that bull market.
Bottom Line for Investors
The U.S. economy likely peaked in Q2 2021, and growth is poised to slow from here, in my view. But that does not necessarily spell doom for the U.S. economy or the stock market. Just because growth is slowing does not mean it’s stopping or reversing. As I look out at corporate earnings estimates, household and corporate balance sheets, business investment, and monetary policy (among other economic fundamentals), I see positive dynamics and a positive outlook.
I have written before in this column that ‘growth is growth,’ even if it is slowing down from a peak or moderating over time. But I think it is also important to note that consensus has U.S. economic growth slowing from here, meaning that growth expectations are also falling. In my view, that’s good news for stocks – if growth expectations fall quickly, it means positive surprises are more possible, which I think is a key driver of returns.
To be prepared for any market outcome, I recommend keeping an eye on key economic data releases, earnings reports, and other key economic factors. Our Just-Released August 2021 Stock Market Outlook Report5, will give you insight into all of it!
This report is packed with newly revised predictions that can help you base your next investment move on hard data. For example, you’ll discover Zacks’ view on:
- Zacks rank S&P 500 sector picks
- Zacks view on equity markets
- What produces 2021 optimism?
- An update on the outlook for Covid-19
- Top stocks in top industries
- Sell-side and buy-side consensus
- And much more
If you have $500,000 or more to invest and want to learn more about these forecasts, click on the link below to get your free report today!
Disclosure
2 Zacks Investment Management reserves the right to amend the terms or rescind the free Stock Market Outlook offer at any time and for any reason at its discretion.
3 Fred Economic Data. June 16, 2021. https://fred.stlouisfed.org/series/GDPC1MD#0
4 Yahoo Finance. August 10, 2021. https://finance.yahoo.com/quote/%5EGSPC?p=%5EGSPC
5 Zacks Investment Management reserves the right to amend the terms or rescind the free Stock Market Outlook offer at any time and for any reason at its discretion.
DISCLOSURE
Past performance is no guarantee of future results. Inherent in any investment is the potential for loss.
Zacks Investment Management, Inc. is a wholly-owned subsidiary of Zacks Investment Research. Zacks Investment Management is an independent Registered Investment Advisory firm and acts as an investment manager for individuals and institutions. Zacks Investment Research is a provider of earnings data and other financial data to institutions and to individuals.
This material is being provided for informational purposes only and nothing herein constitutes investment, legal, accounting or tax advice, or a recommendation to buy, sell or hold a security. Do not act or rely upon the information and advice given in this publication without seeking the services of competent and professional legal, tax, or accounting counsel. Publication and distribution of this article is not intended to create, and the information contained herein does not constitute, an attorney-client relationship. No recommendation or advice is being given as to whether any investment or strategy is suitable for a particular investor. It should not be assumed that any investments in securities, companies, sectors or markets identified and described were or will be profitable. All information is current as of the date of herein and is subject to change without notice. Any views or opinions expressed may not reflect those of the firm as a whole.
Any projections, targets, or estimates in this report are forward looking statements and are based on the firm’s research, analysis, and assumptions. Due to rapidly changing market conditions and the complexity of investment decisions, supplemental information and other sources may be required to make informed investment decisions based on your individual investment objectives and suitability specifications. All expressions of opinions are subject to change without notice. Clients should seek financial advice regarding the appropriateness of investing in any security or investment strategy discussed in this presentation.
Certain economic and market information contained herein has been obtained from published sources prepared by other parties. Zacks Investment Management does not assume any responsibility for the accuracy or completeness of such information. Further, no third party has assumed responsibility for independently verifying the information contained herein and accordingly no such persons make any representations with respect to the accuracy, completeness or reasonableness of the information provided herein. Unless otherwise indicated, market analysis and conclusions are based upon opinions or assumptions that Zacks Investment Management considers to be reasonable. Any investment inherently involves a high degree of risk, beyond any specific risks discussed herein.
The S&P 500 Index is a well-known, unmanaged index of the prices of 500 large-company common stocks, mainly blue-chip stocks, selected by Standard & Poor’s. The S&P 500 Index assumes reinvestment of dividends but does not reflect advisory fees. The volatility of the benchmark may be materially different from the individual performance obtained by a specific investor. An investor cannot invest directly in an index.
The MSCI ACWI captures large and mid-cap representation across 23 Developed Markets (DM) and 27 Emerging Markets (EM) countries. With 2,986 constituents, the index covers approximately 85% of the global investable equity opportunity set. An investor cannot invest directly in an index. The volatility of the benchmark may be materially different from the individual performance obtained by a specific investor.
The MSCI UK All Cap Index captures large, mid, small and micro-cap representation of the UK market. With 819 constituents, the index is comprehensive, covering approximately 99% of the UK equity universe. An investor cannot invest directly in an index. The volatility of the benchmark may be materially different from the individual performance obtained by a specific investor.
The Russell 1000 Value Index is a well-known, unmanaged index of the prices of 1000 large-company value common stocks selected by Russell. The Russell 1000 Value Index assumes reinvestment of dividends but does not reflect advisory fees. An investor cannot directly invest in an index. The volatility of the benchmark may be materially different from the individual performance obtained by a specific investor.
The Russell 1000 Growth Index is a well-known, unmanaged index of the prices of 1000 large-company growth common stocks selected by Russell. The Russell 1000 Growth Index assumes reinvestment of dividends but does not reflect advisory fees. An investor cannot invest directly in an index. The volatility of the benchmark may be materially different from the individual performance obtained by a specific investor.