With the U.S. economy in its seventh year of recovery, and the bull market also in its seventh year (the second-longest bull market in U.S. history after the 1987-2000 bull), coupled with the fact that it’s a presidential election year, the one question in everybody’s mind is how is the U.S. economy performing?
A recent spate of data on the U.S. economy paints a mixed picture where positive momentum in some areas is neutralized by weak trends in others. But this has been the story of the U.S. economy for a better portion of this expansion—a mixed bag that has produced decent job growth but modest overall growth. Below, we look at a roundup of some of the latest figures to get a picture of where we stand year-to-date.
GDP Growth
The Bureau of Economic Analysis (BEA’s) advance estimate of real GDP growth released on July 29 2016 showed U.S. GDP growing by +1.2% in the 2nd quarter, compared to +0.8% in the 1st quarter. Here’s a glance at GDP growth since Q3 of 2013 to give you an idea of how the broad economy has been trending.
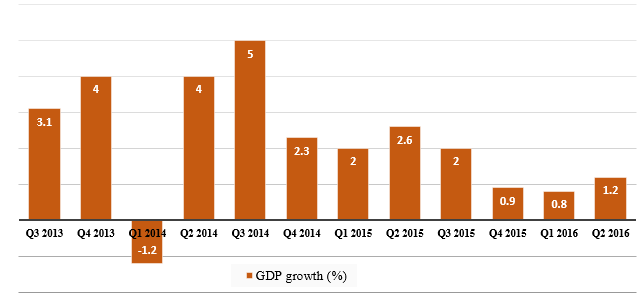 (Source: Bureau of Economic Analysis)
The major contributors of this increase in real GDP was mainly due to the acceleration in Personal Consumption Expenditures (PCE) and exports, while the deterrents to growth were negative contributions from private inventory investment, non-residential fixed investment, residential fixed investment and state & local government spending.
Drivers and Deterrents of the U.S. Economy
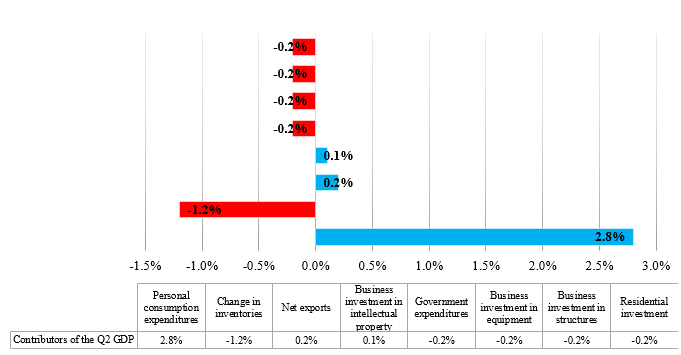 (Source: Bureau of Economic Analysis)
Positive GDP growth is good, but when expectations were anticipated to come in at +2.5%, it loses its luster a bit. A source of reassurance however was that the one major contributor towards this shortfall was contraction in business inventories, which doesn’t generally have a bearing in shaping the future. If you strip away inventories, the economy grew at 2.4%, indicating a steady bounce back from Q1 2016 and in-line with estimates.
Growing Consumer Spending
Consumer spending, the largest component of the economy, was the main driver of growth in Q2 while investments slumped and inventories fell for the first time since 2011. Personal Consumer Expenditures contributed 2.83% points to GDP growth, compared to 1.11% in the previous quarter, marking its highest contribution in six quarters.
The positives from steady job growth, wage growth and cheap fuel prices are finally taking shape in the form of instilling confidence for Americans to spend more at stores, restaurants and vacations, among others. This shift is evident in the fact that consumer spending grew by 4.2% in Q2 compared to 1.6% in Q1, its highest growth rate since Q4 2014. For the 1st six months of 2016 total retail sales grew by 3.1% from the same period in 2015. Spending on durable goods surged by 8.4% following a decline of 0.6% in Q1, while spending on nondurable goods and services saw a quarter over quarter upsurge of 6% and 3%, respectively.
Rising Wages
In June, the average annual pay increase reached 2.6% after hovering around 2% for most of this expansion—a big positive for consumer spending and economic growth. According to the report published by the Bureau of Labor Statistics, compensation costs increased by 0.6% (seasonally adjusted) for the 3-month period ending in June 2016, while for the 12 months ending on June 2016 it grew by 2.3%.
However, the most interesting news from the report was the rise in the wages and salaries component, which makes up nearly 70% of compensation costs. It was up by 2.5% over the last year, while the same reading was 2% in Q2. This indicates that worker pay is not just rising, but rising at a faster pace and in the right places—from cash compensations rather than additional benefits.
A growing economy, bigger and better pay checks, and increased spending are all signs of a healthy economy, but there are a few blemishes preventing it from being outright rosy.
One of these blemishes is shrinking investments. The overall gloomy investment scenario, particularly in the business sector, is an area of concern for the government. For the third quarter in a row, investments in business structures and equipment experienced a decline. The major setback came from…surprise…the Energy sector, which saw very minimal new investments owing to low oil prices (which have fallen back below $40/barrel). The only positive is that investment in intellectual property saw an expansion, and the overall decline in Q2 was slower compared to Q1.
Non-residential investments declined by 2.2% in Q2 compared to 3.4% in Q1. Investment in structures fell 7.9% and equipment declined 3.5% while investment in intellectual property products expanded by 3.5%. Further residential investment declined 6.1% following a rise of 7.8% in Q1, the first fall since the three months ending March 2014.
Another blemish was declining productivity. U.S. productivity growth, the greatest determinant of living standards, has been lower for the past five years than any other five-year period on record, and Q1 2016 saw a further decline of 0.6%. Although Q2 results are yet to be released, it is broadly believed that any further decline might have a significant impact on the economy in future.
Bottom Line for Investors
As ever, this economic expansion has been a mixed bag for the U.S. economy with patches of weakness often neutralizing patches of growth. The same could be said of corporate earnings, which have felt five consecutive quarters of decline (but not for all sectors). For every quarter of negative growth, there have been sectors that have seen solid growth. But investors should remember that stocks don’t need blustering growth to do well, modest and mixed bag growth also work just fine to support prices. You can look at the last seven years of this expansion as evidence of that.
So, what does this mixed bag of growth mean in terms of investment strategy? While the market has not been the smoothest ride thus far, our approach to managing assets at Zacks Investment Management focuses on risk management and your core objective—for many, this often means preserving wealth, creating an income stream or focusing on growth. The success of our investment strategies speak for themselves as Morningstar currently ranks five of our strategies in the top 10% of their respective classes (as of 6/30/16)—we call this our “Dean’s List.” Learn more about these strategies and how they might help your portfolio by clicking below…
Disclosure
Zacks Investment Management, Inc. is a wholly-owned subsidiary of Zacks Investment Research. Zacks Investment Management is an independent Registered Investment Advisory firm and acts an investment manager for individuals and institutions. Zacks Investment Research is a provider of earnings data and other financial data to institutions and to individuals.
This material is being provided for informational purposes only and nothing herein constitutes investment, legal, accounting or tax advice, or a recommendation to buy, sell or hold a security. Do not act or rely upon the information and advice given in this publication without seeking the services of competent and professional legal, tax, or accounting counsel. The information contained herein has been obtained from sources believed to be reliable but we do not guarantee accuracy or completeness. Publication and distribution of this article is not intended to create, and the information contained herein does not constitute, an attorney-client relationship. No recommendation or advice is being given as to whether any investment or strategy is suitable for a particular investor. It should not be assumed that any investments in securities, companies, sectors or markets identified and described were or will be profitable. All information is current as of the date of herein and is subject to change without notice. Any views or opinions expressed may not reflect those of the firm as a whole.