Are U.S. Consumers Borrowing Their Way to Strong Spending?
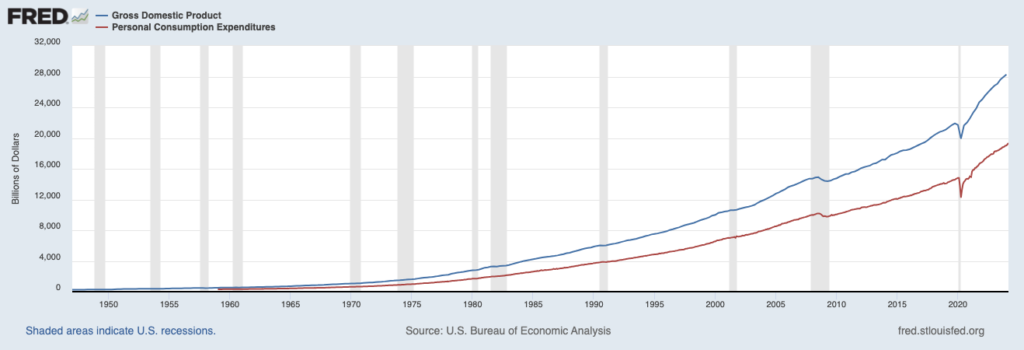
We often cite the U.S. consumer as the key engine driving economic growth, and for good reason—in Q1 2024, personal consumption expenditures (PCE) accounted for nearly 68% of GDP. In short, strong spending begets strong economic growth. This relationship is evident in the chart below, with PCE (red line) and GDP moving almost perfectly together.1
Consumer Spending is the Main Driver of GDP Growth
I’ve written many times recently that U.S. consumers are being bolstered by a strong jobs market and rising wages, which have more than offset the impact of higher prices. But recent data from the New York Fed’s Quarter Report on Household Debt and Credit shows that consumers may also be pulling strength from another, less fundamentally sound source: borrowed money.
According to the report, total household debt rose by $184 billion to reach a staggering $17.69 trillion by the end of Q1 2024. Critically, the New York Fed reported that almost 9% of credit card balances and 8% of auto loans (annualized) had transitioned into delinquency, with rising numbers across all age groups.
Get Market Insights in Our Brand-New Stock Market Outlook Report!
I’m inviting all Mitch on the Market readers to download our brand-new Stock Market Outlook Report. This report includes just-released commentary and insights into the market to help you make decisions based on data and fundamentals instead of fears and media hysteria.
You’ll get insight on:
• Expert market strategy commentary
• Zacks sector picks
• Key U.S. economic data
• Global market data
• Zacks S&P 500 earnings insights
• And more…
If you have $500,000 or more to invest and want ideas on how to invest in a strong market, click on the link below to get your free report today!3
June 2024 Stock Market Outlook3
Total Household Debt Has Risen Significantly Over the Past Couple of Years

Economic naysayers framed the New York Fed data as evidence that current economic strength is something of an illusion, with consumer spending numbers being propped up by households falling into financial distress.
There is some truth to this. Taken at face value, the New York Fed report shows clear signs of stress forming on some U.S. household balance sheets. Indeed, for all debt outside of student loans (which has benefited from forgiveness programs), delinquency has been steadily rising since Q4 2021 after the historic lows reached during the COVID-19 pandemic. Credit card delinquencies have risen past pre-pandemic levels.
Before sounding alarm bells, however, some context is needed. Just because household finances in aggregate have gotten worse over the past several quarters does not mean households are in bad shape overall.
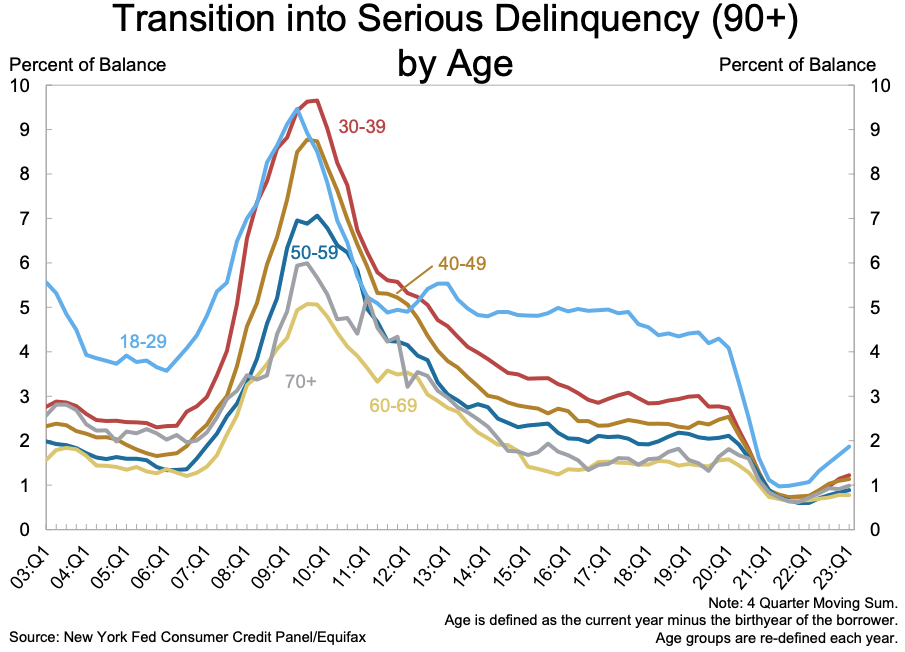
For one, delinquencies over 90 days remain at historically low levels even with the recent increase. As seen in the chart below, delinquencies are nowhere near levels experienced during the 2008 Global Financial Crisis and are lower than they were from 2014 to 2020—which are generally considered strong economic growth years.
Taking on more debt is certainly not helping U.S. household finances, but I also don’t think it’s fair to say the situation is turning dire. The clearest evidence comes from looking at household debt service payments as a percent of disposable personal income. In other words, the question to ask is: how much is it costing Americans to service their debt?
The answer is not much, at least when comparing current levels to the past 50 years. Americans are taking on more debt, but their incomes have also been rising such that the amount of income that goes to paying off debt each month is still at historically low levels, as seen in the chart below.
Household Debt Service Payments as a % of Disposable Personal Income

Bottom Line for Investors
U.S. household debt has increased recently, but that’s also what we’d generally expect to see in an economic expansion. Wages are up, borrowing is up, and spending is up. U.S. consumers have loathed inflationary pressures, but they’re also feeling pretty empowered at the moment, in my view. The strong labor market deserves the credit.
Rising delinquencies will be important to watch going forward, however, particularly if we begin to see cracks in the jobs market. But I do not think that moment has arrived, and for now, I see U.S. households in strong shape overall.
To give you a deeper look into the stock market and what you can expect in the second half of the year, I’ve arranged for our readers to download our brand-new June 2024 Stock Market Outlook6.
This report includes just released commentary and insights into the market to help you make decisions based on data and fundamentals instead of fears and media hysteria. You’ll get insight into:
• Expert Market Strategy Commentary—June’s topic is Earnings Matter More than the Fed
• Zacks Sector Picks—An invaluable resource for asset allocation
• Key U.S. Economic Data—The latest numbers and trends, plus key takeaways
• Global Market Data—The latest trends in global stock, bond, and commodity markets
• Zacks S&P 500 Earnings Insights—Our roundup of the latest market and sector forecasts and trends
If you have $500,000 or more to invest, get your portfolio better prepared for what’s to come by reading this new report today.
Disclosure
2 Fred Economic Data. April 25, 2024. https://fred.stlouisfed.org/series/GDP#
3 Zacks Investment Management reserves the right to amend the terms or rescind the free-Stock Market Outlook Report offer at any time and for any reason at its discretion.
4 Federal Reserve Bank of New York. 2024. https://www.newyorkfed.org/microeconomics/hhdc
5 Fred Economic Data. April 2, 2024. https://fred.stlouisfed.org/series/TDSP
6 Zacks Investment Management reserves the right to amend the terms or rescind the free-Stock Market Outlook Report offer at any time and for any reason at its discretion.
DISCLOSURE
Past performance is no guarantee of future results. Inherent in any investment is the potential for loss.
Zacks Investment Management, Inc. is a wholly-owned subsidiary of Zacks Investment Research. Zacks Investment Management is an independent Registered Investment Advisory firm and acts as an investment manager for individuals and institutions. Zacks Investment Research is a provider of earnings data and other financial data to institutions and to individuals.
This material is being provided for informational purposes only and nothing herein constitutes investment, legal, accounting or tax advice, or a recommendation to buy, sell or hold a security. Do not act or rely upon the information and advice given in this publication without seeking the services of competent and professional legal, tax, or accounting counsel. Publication and distribution of this article is not intended to create, and the information contained herein does not constitute, an attorney-client relationship. No recommendation or advice is being given as to whether any investment or strategy is suitable for a particular investor. It should not be assumed that any investments in securities, companies, sectors or markets identified and described were or will be profitable. All information is current as of the date of herein and is subject to change without notice. Any views or opinions expressed may not reflect those of the firm as a whole.
Any projections, targets, or estimates in this report are forward looking statements and are based on the firm’s research, analysis, and assumptions. Due to rapidly changing market conditions and the complexity of investment decisions, supplemental information and other sources may be required to make informed investment decisions based on your individual investment objectives and suitability specifications. All expressions of opinions are subject to change without notice. Clients should seek financial advice regarding the appropriateness of investing in any security or investment strategy discussed in this presentation.
Certain economic and market information contained herein has been obtained from published sources prepared by other parties. Zacks Investment Management does not assume any responsibility for the accuracy or completeness of such information. Further, no third party has assumed responsibility for independently verifying the information contained herein and accordingly no such persons make any representations with respect to the accuracy, completeness or reasonableness of the information provided herein. Unless otherwise indicated, market analysis and conclusions are based upon opinions or assumptions that Zacks Investment Management considers to be reasonable. Any investment inherently involves a high degree of risk, beyond any specific risks discussed herein.
The S&P 500 Index is a well-known, unmanaged index of the prices of 500 large-company common stocks, mainly blue-chip stocks, selected by Standard & Poor’s. The S&P 500 Index assumes reinvestment of dividends but does not reflect advisory fees. The volatility of the benchmark may be materially different from the individual performance obtained by a specific investor. An investor cannot invest directly in an index.
The Russell 1000 Growth Index is a well-known, unmanaged index of the prices of 1000 large-company growth common stocks selected by Russell. The Russell 1000 Growth Index assumes reinvestment of dividends but does not reflect advisory fees. An investor cannot invest directly in an index. The volatility of the benchmark may be materially different from the individual performance obtained by a specific investor.
Nasdaq Composite Index is the market capitalization-weighted index of over 3,300 common equities listed on the Nasdaq stock exchange. The types of securities in the index include American depositary receipts, common stocks, real estate investment trusts (REITs) and tracking stocks, as well as limited partnership interests. The index includes all Nasdaq-listed stocks that are not derivatives, preferred shares, funds, exchange-traded funds (ETFs) or debenture securities. An investor cannot invest directly in an index. The volatility of the benchmark may be materially different from the individual performance obtained by a specific investor.
The Dow Jones Industrial Average measures the daily stock market movements of 30 U.S. publicly-traded companies listed on the NASDAQ or the New York Stock Exchange (NYSE). The 30 publicly-owned companies are considered leaders in the United States economy. An investor cannot directly invest in an index. The volatility of the benchmark may be materially different from the individual performance obtained by a specific investor.
The Bloomberg Global Aggregate Index is a flagship measure of global investment grade debt from twenty-four local currency markets. This multi-currency benchmark includes treasury, government-related, corporate and securitized fixed-rate bonds from both developed and emerging markets issuers. An investor cannot invest directly in an index. The volatility of the benchmark may be materially different from the individual performance obtained by a specific investor.
The ICE Exchange-Listed Fixed & Adjustable Rate Preferred Securities Index is a modified market capitalization weighted index composed of preferred stock and securities that are functionally equivalent to preferred stock including, but not limited to, depositary preferred securities, perpetual subordinated debt and certain securities issued by banks and other financial institutions that are eligible for capital treatment with respect to such instruments akin to that received for issuance of straight preferred stock. An investor cannot invest directly in an index. The volatility of the benchmark may be materially different from the individual performance obtained by a specific investor.
The MSCI ACWI ex U.S. Index captures large and mid-cap representation across 22 of 23 Developed Markets (DM) countries (excluding the United States) and 24 Emerging Markets (EM) countries. The index covers approximately 85% of the global equity opportunity set outside the U.S. An investor cannot invest directly in an index. The volatility of the benchmark may be materially different from the individual performance obtained by a specific investor.
The Russell 2000 Index is a well-known, unmanaged index of the prices of 2000 small-cap company common stocks, selected by Russell. The Russell 2000 Index assumes reinvestment of dividends but does not reflect advisory fees. An investor cannot invest directly in an index. The volatility of the benchmark may be materially different from the individual performance obtained by a specific investor.
The S&P Mid Cap 400 provides investors with a benchmark for mid-sized companies. The index, which is distinct from the large-cap S&P 500, is designed to measure the performance of 400 mid-sized companies, reflecting the distinctive risk and return characteristics of this market segment.
The S&P 500 Pure Value index is a style-concentrated index designed to track the performance of stocks that exhibit the strongest value characteristics by using a style-attractiveness-weighting scheme. An investor cannot directly invest in an index. The volatility of the benchmark may be materially different from the individual performance obtained by a specific investor.