The debt ceiling debate is once again flooding the national airwaves, as the U.S. rapidly approaches what is known as the “X Date” – or the date when the U.S. Treasury would run out of cash needed to pay bills.
The Treasury owes interest payments on existing debt, but the department also needs cash to pay Social Security, veteran’s benefits, and paychecks for federal employees and military families. It is important for readers to understand that raising the debt limit does not authorize new spending by Congress – it simply allows the Treasury to issue new debt to cover spending already authorized by Congress.1
As such, raising the debt ceiling is critical and necessary for the country to pay its bills on time, but it is also routine – the debt limit has been raised almost 100 times since World War II. Before the world wars, Congress had to approve borrowing every time debt was needed to finance new spending, but war spending changed the process – and in some cases, made it political.
______________________________________________________________________________
Make the Most of Your Investments During This Market
The current debt ceiling debate is heating up…and so is volatility in the market, but don’t panic! Instead of making hasty investment decisions, keep your eye on important economic indicators with our just-released October Stock Market Outlook Report.
This report will help you make decisions based on data and fundamentals instead of fears and timing the market. This report contains some of our key forecasts to consider such as:
- Zacks rank S&P 500 sector picks
- Zacks view on equity markets
- What produces 2021 optimism?
- Zacks forecasts for the remainder of the year
- Zacks ranks industry tables
- Sell-side and buy-side consensus
- And much more
If you have $500,000 or more to invest and want to learn more about these forecasts, click on the link below to get your free report today!
IT’S FREE. Download the Just-Released October 2021 Stock Market Outlook2
______________________________________________________________________________
Some readers may recall the “fiscal cliff” scare back in 2011, which was so down-to-the-wire that Standard & Poor’s lowered the U.S.’s credit rating from AAA to AA. According to the Government Accountability Office, the lowered credit rating cost U.S. taxpayers about $1.3 billion for the fiscal year, which is small relative to total spending but still represents an avoidable cost. The stock market endured a real correction in 2011, falling some -19% from the intra-year peak but ultimately finishing flat for the calendar year and rising +13% in 2012.
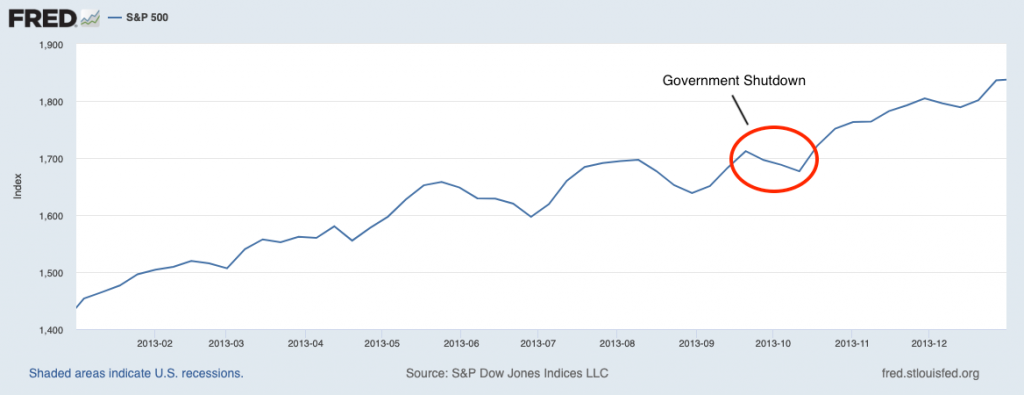
Then in 2013 many readers likely remember the U.S. government shutdown that lasted 16 days (from October 1 to October 17). In that year, the government failed to appropriate funds for the fiscal year 2014 nor were they able to pass a continuing resolution to supply financing for government obligations.
Eventually – and as they always have – Congress passed a bill funding the government and raising the debt ceiling, but the process for getting there was politically fraught. Despite the very public debate and political infighting, the stock market (S&P 500 index) did not react much at all. As you can see in the chart below, the S&P 500 pulled back slightly but did not waver from its overall upward trend for the year. The index finished up +30%.3
The debt ceiling issue is nothing new, and Congress has gone down to the wire with the issue before. Despite political tension, 11th-hour deals have always found a way to get done. While it appears that the politics has gotten uglier and more hostile over the years, I do not foresee a scenario where the U.S. government would be allowed to default on its debt – such an outcome benefits no one and would only serve to disrupt financial markets and raise borrowing costs.
The impact on the equity markets in 2021 may just depend on how far Congress lets the issue go, with the worst-case scenario being the Treasury running out of cash and missing payments on existing obligations (“X Date”). The Treasury estimates the X Date could fall somewhere between October 15 and November 4, so at the very latest Congress needs to act by then.
Bottom Line for Investors
For investors, the uncertainty surrounding the debate could lead to some short-term volatility, but I do not believe the medium to longer-term trajectory of the markets or the economy should be seriously affected. We’re still on a strong path of growth, in my view, and corporate earnings should not be materially affected by a political process.
To keep your investments on track during turbulent times, we recommend that you focus on the fundamentals and facts that can positively impact your investments in the long term.
Our Just-Released October 2021 Stock Market Outlook Report4, will help you do just that!
This report is packed with newly revised predictions that can help you base your next investment move on hard data. For example, you’ll discover Zacks’ view on:
- Zacks rank S&P 500 sector picks
- Zacks view on equity markets
- What produces 2021 optimism?
- Zacks forecasts for the remainder of the year
- Zacks ranks industry tables
- Sell-side and buy-side consensus
- And much more
If you have $500,000 or more to invest and want to learn more about these forecasts, click on the link below to get your free report today!
Disclosure
2 Zacks Investment Management reserves the right to amend the terms or rescind the free Stock Market Outlook offer at any time and for any reason at its discretion.
3 Wall Street Journal. September 27, 2021. https://www.wsj.com/articles/senate-republicans-set-to-block-bill-tying-short-term-funding-bill-to-debt-ceiling-11632772705?mod=hp_lead_pos1
4 Fred Economic Data. September 27, 2021. https://fred.stlouisfed.org/series/SP500#0
5 Zacks Investment Management reserves the right to amend the terms or rescind the free Stock Market Outlook offer at any time and for any reason at its discretion.
DISCLOSURE
Past performance is no guarantee of future results. Inherent in any investment is the potential for loss.
Zacks Investment Management, Inc. is a wholly-owned subsidiary of Zacks Investment Research. Zacks Investment Management is an independent Registered Investment Advisory firm and acts as an investment manager for individuals and institutions. Zacks Investment Research is a provider of earnings data and other financial data to institutions and to individuals.
This material is being provided for informational purposes only and nothing herein constitutes investment, legal, accounting or tax advice, or a recommendation to buy, sell or hold a security. Do not act or rely upon the information and advice given in this publication without seeking the services of competent and professional legal, tax, or accounting counsel. Publication and distribution of this article is not intended to create, and the information contained herein does not constitute, an attorney-client relationship. No recommendation or advice is being given as to whether any investment or strategy is suitable for a particular investor. It should not be assumed that any investments in securities, companies, sectors or markets identified and described were or will be profitable. All information is current as of the date of herein and is subject to change without notice. Any views or opinions expressed may not reflect those of the firm as a whole.
Any projections, targets, or estimates in this report are forward looking statements and are based on the firm’s research, analysis, and assumptions. Due to rapidly changing market conditions and the complexity of investment decisions, supplemental information and other sources may be required to make informed investment decisions based on your individual investment objectives and suitability specifications. All expressions of opinions are subject to change without notice. Clients should seek financial advice regarding the appropriateness of investing in any security or investment strategy discussed in this presentation.
Certain economic and market information contained herein has been obtained from published sources prepared by other parties. Zacks Investment Management does not assume any responsibility for the accuracy or completeness of such information. Further, no third party has assumed responsibility for independently verifying the information contained herein and accordingly no such persons make any representations with respect to the accuracy, completeness or reasonableness of the information provided herein. Unless otherwise indicated, market analysis and conclusions are based upon opinions or assumptions that Zacks Investment Management considers to be reasonable. Any investment inherently involves a high degree of risk, beyond any specific risks discussed herein.
The S&P 500 Index is a well-known, unmanaged index of the prices of 500 large-company common stocks, mainly blue-chip stocks, selected by Standard & Poor’s. The S&P 500 Index assumes reinvestment of dividends but does not reflect advisory fees. The volatility of the benchmark may be materially different from the individual performance obtained by a specific investor. An investor cannot invest directly in an index.
The MSCI ACWI captures large and mid-cap representation across 23 Developed Markets (DM) and 27 Emerging Markets (EM) countries. With 2,986 constituents, the index covers approximately 85% of the global investable equity opportunity set. An investor cannot invest directly in an index. The volatility of the benchmark may be materially different from the individual performance obtained by a specific investor.
The MSCI UK All Cap Index captures large, mid, small and micro-cap representation of the UK market. With 819 constituents, the index is comprehensive, covering approximately 99% of the UK equity universe. An investor cannot invest directly in an index. The volatility of the benchmark may be materially different from the individual performance obtained by a specific investor.
The Russell 1000 Value Index is a well-known, unmanaged index of the prices of 1000 large-company value common stocks selected by Russell. The Russell 1000 Value Index assumes reinvestment of dividends but does not reflect advisory fees. An investor cannot directly invest in an index. The volatility of the benchmark may be materially different from the individual performance obtained by a specific investor.
The Russell 1000 Growth Index is a well-known, unmanaged index of the prices of 1000 large-company growth common stocks selected by Russell. The Russell 1000 Growth Index assumes reinvestment of dividends but does not reflect advisory fees. An investor cannot invest directly in an index. The volatility of the benchmark may be materially different from the individual performance obtained by a specific investor.
The Russell 2000 Index is a well-known, unmanaged index of the prices of 2000 small-cap company common stocks, selected by Russell. The Russell 2000 Index assumes reinvestment of dividends but does not reflect advisory fees. An investor cannot invest directly in an index. The volatility of the benchmark may be materially different from the individual performance obtained by a specific investor.