Coronavirus hospitalizations and deaths have been falling throughout 2021, and most health experts agree the worst of the pandemic is now behind us. I think we’re at a point where we can confidently look forward to economic and social ‘normalization,’ with restrictions gradually falling away. I’m bullish, but I’m also cautious.
Let me explain the bullish part first.
For starters, earnings looked really good in Q4. Total Q4 earnings for 482 of 500 S&P 500 companies were up +3.5% year-over-year on +2.9% revenues, with 79.7% beating earnings-per-share (EPS) estimates and 75.5% beating revenue estimates. Think about this earnings comparison for a minute: In Q4 2019, there was no pandemic, and the economy was strong by nearly every measure. Yet even with all of the pandemic-induced destruction, S&P 500 companies still managed to grow year-over-year in Q4 2020. Pretty remarkable.
What’s more, 79.7% represents an above-average proportion of companies beating consensus estimates, and guidance has been positive as well. This favorable guidance has been helping push estimates for the current and coming quarters higher – all good signs. Full-year 2021 earnings for the S&P 500 are expected to be up 28.1% relative to 2020 estimates. In short, earnings season has been very supportive of the ‘economic resurgence’ narrative, and for me it is certainly a bullish driver.1
__________________________________________________________________________
Focus on the Fundamentals Instead of Timing the Market!
There are currently many positives in the market, but there are still reasons to be cautious in your decision-making process. Factors, such as, interest rates, investor optimism, and over-supply, could shift the market at any time. So, instead of focusing on short-term choices, I recommend sticking to the fundamentals and maintaining a diversified portfolio.
To help you do this, I am offering all readers our just-released Stock Market Outlook report. This report contains some of our key forecasts to consider such as:
- S&P 500 earnings growth
- Outlook for underlying U.S. economy?
- U.S. returns expectations for 2021
- What produces 2021 optimism?
- Is it time to buy U.S. stocks?
- Update on U.S. fiscal stimulus
- And much more…
If you have $500,000 or more to invest and want to learn more about these forecasts, click on the link below to get your free report today!
IT’S FREE. Download the Just-Released Stock Market Outlook Report2
__________________________________________________________________________
Then there are the monetary and fiscal policy drivers, which remain in full accommodative mode. The Federal Reserve used its January meeting to assure investors they will remain in support mode until the labor market shows significant improvement, which is likely to take at least this year but probably longer. The fed funds rate will not move in 2021, and the bond purchase program won’t be tapered without ample warning, in my view.
On the fiscal side, the House of Representatives has already passed a version of the $1.9 trillion American Rescue Plan, which includes another $1,400 in direct stimulus payments, an additional $1,000 child tax credit, and an extension of unemployment benefits to August 29. The sheer size of the bill and the inclusion of direct transfer payments only add to the already massive amounts of liquidity sloshing around in the capital markets.3
What makes me cautious? I’ll focus on three areas: interest rates, too much investor optimism, and over-supply.
Start with interest rates. One of the reasons the stock market has been comfortable trading at such a high multiple, in my view, is the understanding that interest rates would remain “lower for longer.” We know the Federal Reserve is likely to keep short rates anchored to the zero bound, but longer-dated US Treasuries have been marching steadily higher over the last year (see chart below). I’ve written before that as interest rates go up, the “risk premium” – which is the spread between the risk-free rate on Treasuries and the yield on the S&P 500 – shrinks. A narrowing risk premium could mean trouble for high valuation stocks, in my view.
The 10-Year and 30-Year U.S. Treasury Bond Yields: On the Rise
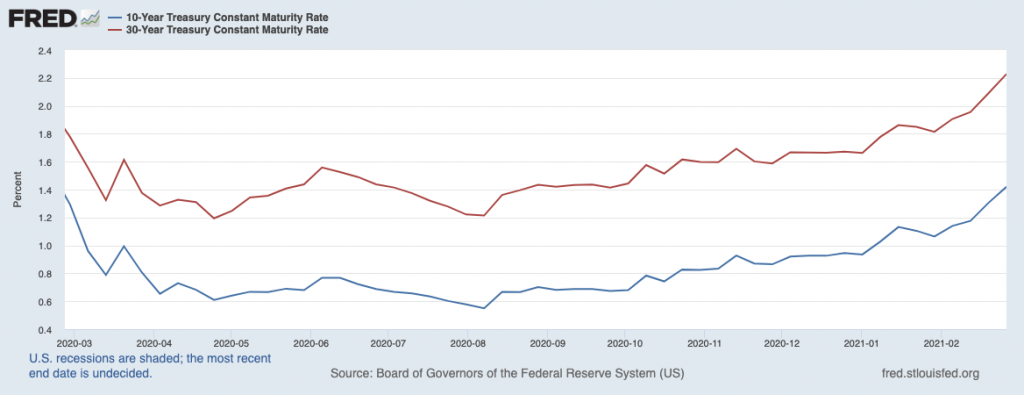
Source: Federal Reserve Bank of St. Louis4
The next cause for caution is investor optimism, or specifically, too much of it. Most readers are aware of the retail trading mania going on, with get-rich-quick storylines popping up every day (mostly on the internet). It’s also true that individual investors opened more than 10 million new brokerage accounts in 2020, which was a record, and margin balances have been steadily rising. Too much optimism is usually bad news for stocks, and I’m cautious in 2021 about investor sentiment creeping towards euphoria.
Finally, there’s the over-supply issue. The number of publicly-traded companies is on the rise after a 20+ year slump. From 1997 to 2017, the number of listed companies dropped from 8,500 to 4,500, spurred by the tech bubble bursting. The tide has been shifting. After modest upticks in 2018 and 2019, the number of listed companies surged by 200 in 2020, and investors expect 2021 to post even bigger increases. “SPACs” are all the rage on Wall Street, as an increasing number of (often risky) start-ups seem eager to raise capital and eschew the regulatory requirements associated with IPOs. When companies are clamoring to issue shares in a hot market, I think that’s generally a foreboding trend.
Bottom Line for Investors
There’s always a push and pull of positive and negative factors to weigh when investing in equities. When I look out at 2021, I see quite a few of both, which to me means the second half of this year could be quite volatile. Even still, I remain confident the economic surge on the other side of this pandemic will be even better than expected, and I think the positive forces in the economy and markets will far outweigh the negative forces.
Preparing for volatility instead of trying to time the market is the key to long-term financial success. To better prepare, you have to focus on key data points and economic indicators that could positively impact your investments in the future. To help guide you, I am offering all readers our Just-Released Stock Market Outlook Report.
This report looks at several factors that are producing optimism right now and contains some of our key forecasts to consider such as:
- S&P 500 earnings growth
- Outlook for underlying U.S. economy?
- U.S. returns expectations for 2021
- What produces 2021 optimism?
- Is it time to buy U.S. stocks?
- Update on U.S. fiscal stimulus
- And much more…
If you have $500,000 or more to invest and want to learn more about these forecasts, click on the link below to get your free report today!
Disclosure
2 Zacks Investment Management reserves the right to amend the terms or rescind the free Stock Market Outlook offer at any time and for any reason at its discretion.
3 Black Rock. February 12, 2021. https://www.blackrock.com/us/individual/insights/multi-asset-income-monthly
4 Fred Economic Data. February 26, 2021. https://fred.stlouisfed.org/series/DGS10#0
5 Zacks Investment Management reserves the right to amend the terms or rescind the free Stock Market Outlook offer at any time and for any reason at its discretion.
DISCLOSURE
Past performance is no guarantee of future results. Inherent in any investment is the potential for loss.
Zacks Investment Management, Inc. is a wholly-owned subsidiary of Zacks Investment Research. Zacks Investment Management is an independent Registered Investment Advisory firm and acts as an investment manager for individuals and institutions. Zacks Investment Research is a provider of earnings data and other financial data to institutions and to individuals.
This material is being provided for informational purposes only and nothing herein constitutes investment, legal, accounting or tax advice, or a recommendation to buy, sell or hold a security. Do not act or rely upon the information and advice given in this publication without seeking the services of competent and professional legal, tax, or accounting counsel. Publication and distribution of this article is not intended to create, and the information contained herein does not constitute, an attorney-client relationship. No recommendation or advice is being given as to whether any investment or strategy is suitable for a particular investor. It should not be assumed that any investments in securities, companies, sectors or markets identified and described were or will be profitable. All information is current as of the date of herein and is subject to change without notice. Any views or opinions expressed may not reflect those of the firm as a whole.
Any projections, targets, or estimates in this report are forward looking statements and are based on the firm’s research, analysis, and assumptions. Due to rapidly changing market conditions and the complexity of investment decisions, supplemental information and other sources may be required to make informed investment decisions based on your individual investment objectives and suitability specifications. All expressions of opinions are subject to change without notice. Clients should seek financial advice regarding the appropriateness of investing in any security or investment strategy discussed in this presentation.
Certain economic and market information contained herein has been obtained from published sources prepared by other parties. Zacks Investment Management does not assume any responsibility for the accuracy or completeness of such information. Further, no third party has assumed responsibility for independently verifying the information contained herein and accordingly no such persons make any representations with respect to the accuracy, completeness or reasonableness of the information provided herein. Unless otherwise indicated, market analysis and conclusions are based upon opinions or assumptions that Zacks Investment Management considers to be reasonable. Any investment inherently involves a high degree of risk, beyond any specific risks discussed herein.
The S&P 500 Index is a well-known, unmanaged index of the prices of 500 large-company common stocks, mainly blue-chip stocks, selected by Standard & Poor’s. The S&P 500 Index assumes reinvestment of dividends but does not reflect advisory fees. The volatility of the benchmark may be materially different from the individual performance obtained by a specific investor. An investor cannot invest directly in an index.
The Russell 1000 Growth Index is a well-known, unmanaged index of the prices of 1000 large-company growth common stocks selected by Russell. The Russell 1000 Growth Index assumes reinvestment of dividends but does not reflect advisory fees. An investor cannot invest directly in an index. The volatility of the benchmark may be materially different from the individual performance obtained by a specific investor.
Nasdaq Composite Index is the market capitalization-weighted index of over 3,300 common equities listed on the Nasdaq stock exchange. The types of securities in the index include American depositary receipts, common stocks, real estate investment trusts (REITs) and tracking stocks, as well as limited partnership interests. The index includes all Nasdaq-listed stocks that are not derivatives, preferred shares, funds, exchange-traded funds (ETFs) or debenture securities. An investor cannot invest directly in an index. The volatility of the benchmark may be materially different from the individual performance obtained by a specific investor.
The Dow Jones Industrial Average measures the daily stock market movements of 30 U.S. publicly-traded companies listed on the NASDAQ or the New York Stock Exchange (NYSE). The 30 publicly-owned companies are considered leaders in the United States economy. An investor cannot directly invest in an index. The volatility of the benchmark may be materially different from the individual performance obtained by a specific investor.
Returns for each strategy and the corresponding Morningstar Universe reflect the annualized returns for the periods indicated. The Morningstar Universes used for comparative analysis are constructed by Morningstar (median performance) and data is provided to Zacks by Zephyr Style Advisor. The percentile ranking for each Zacks Strategy is based on the gross comparison for Zacks Strategies vs. the indicated universe rounded up to the nearest whole percentile. Other managers included in universe by Morningstar may exhibit style drift when compared to Zacks Investment Management portfolio. Neither Zacks Investment Management nor Zacks Investment Research has any affiliation with Morningstar. Neither Zacks Investment Management nor Zacks Investment Research had any influence of the process Morningstar used to determine this ranking.
The Russell 1000 Value Index is a well-known, unmanaged index of the prices of 1000 large-company value common stocks selected by Russell. The Russell 1000 Value Index assumes reinvestment of dividends but does not reflect advisory fees. An investor cannot directly invest in an index. The volatility of the benchmark may be materially different from the individual performance obtained by a specific investor.