Should Investors Be Concerned About Rapidly Rising Oil Prices?
Oil prices have been on the move—but not in the direction that favors consumers.
In the first quarter of 2024, the price of a barrel of West Texas Intermediate crude has risen almost 15%, and Brent crude futures – the global benchmark – are up 18%. That puts the global price of a barrel of oil above $90 as I write, which has already fed into higher gas prices. According to AAA, gas prices are also up 15% this year, with the national average at $3.57 a gallon.1
Oil Prices Made a Sizable Move in Q1 2024
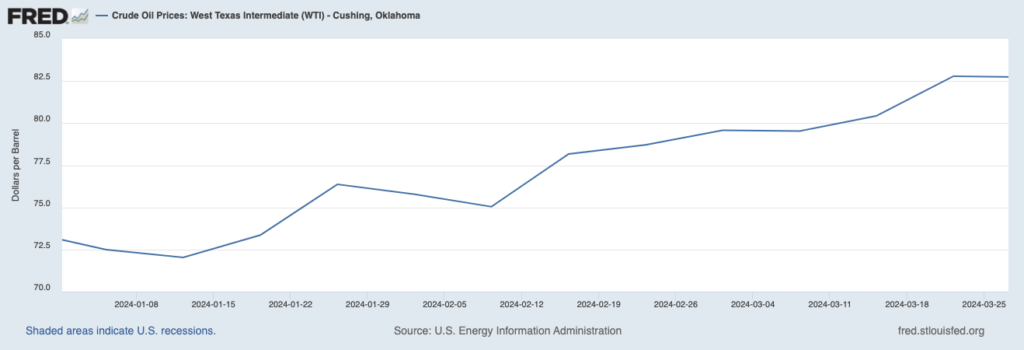
There are a few forces driving up prices. On the supply side, the two ongoing wars have caused disruptions. Ukrainian attacks on Russian oil-refining facilities have dented diesel exports, which has prompted refiners elsewhere to increase output (requiring cruder). Traders also fear that escalations in the Middle East could impact production, though we haven’t seen major disruptions to date.
Download Our Current Market Insights
Rising oil and commodity prices could drive short-term volatility in the markets, in what already could be a volatile year given the upcoming election. Investors should have a clear sense of where the opportunities are if or when that happens.
To give investors these insights about the current market landscape, I am pleased to offer our free April 2024 Stock Market Outlook3, which identifies key opportunities and risks, enabling readers to make informed investment decisions in today’s dynamic environment. You’ll gain access to detailed insights, such as:
• U.S. macro-outlook- San Francisco Fed “Fed views”
• March sell-side and buy-side consensus at a glance
• Zacks Rank S&P500 sector picks
• Top-down S&P500 yearend 2023 and 2024 targets
• Zacks rank March industry tables
• And much more!
If you have $500,000 or more to invest and want ideas on how to invest in a strong market, click on the link below to get your free report today!
IT’S FREE. Download the April 2024 Stock Market Outlook3
The more meaningful hit to supply is actually coming from the U.S. The United States is the world’s largest oil producer, and it looks like output could weaken from here. When oil prices went up last year, producers tapped drilled-but-uncompleted wells, which sent production to all-time highs—and also put downward pressure on prices. Lower prices and still-high interest rates have discouraged new investment, which is evident in steeply declining oil rig counts.
On the demand side, a large swath of the global economy looks like it’s flipping back into growth mode, which of course puts upward pressure on crude oil and other raw materials. Other factors – like rising demand for jet fuel from robust travel activity, and cargo ship disruptions in the Red Sea that are requiring more fuel to sail around the southern tip of Africa – are adding to the demand equation. All told, the International Energy Agency estimates 103 million barrels per day of global oil consumption, which would be a record.
In the near term, I would not be surprised if falling U.S. output and rising global demand place even more upward pressure on crude oil prices. This may also be a reason that the Energy sector outperformed in the first quarter, rising 13.7% in the first three months compared to the S&P 500’s 10.6% gain.
So, should investors be concerned if oil prices keep going up in the coming months, perhaps even crossing $100 a barrel?
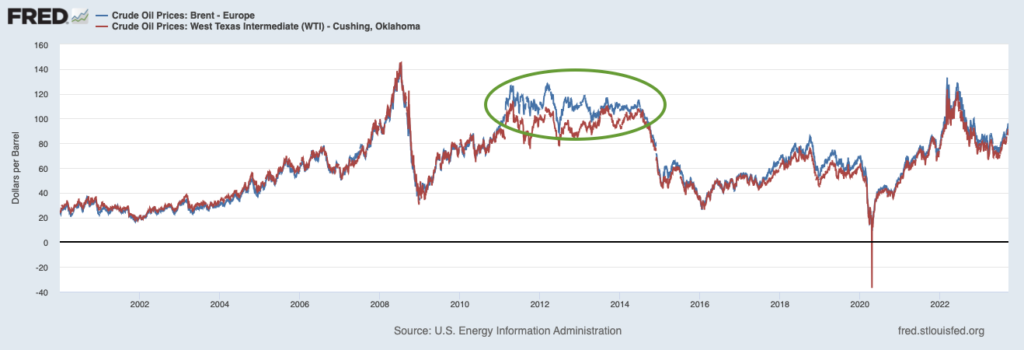
Not necessarily. As I’ve written before, there is not a historically tight correlation between higher oil prices and weak economic growth and/or an underperforming stock market. The chart below demonstrates this point. Pictured is the global price of Brent Crude and West Texas Intermediate oil going back to 2000. I’ve circled in green a period of about 4 years when oil prices hovered in the $100 a barrel range, which were also years when the economy grew consistently – albeit modestly – and stocks remained locked in a bull market.
The U.S. economy can withstand higher oil prices
Oil production also is sensitive to price, not global volumes. If the price of a barrel of oil rises above $100 a barrel, I think we’d see major producers ramp up to take advantage of higher margins. Such an outcome is consistent with what we’ve seen historically, and new technology allows producers to increase output fairly quickly.
Bottom Line for Investors
Higher oil prices are not without risks. The U.S. economy is at a point in this cycle where inflation needs to remain steady or continue trending downward so that the interest rate outlook and expectations for rate cuts in 2024 remain intact. Since oil is used in the production of everything from plastics, fertilizers, and of course gasoline, higher crude prices can impact the cost of travel, food, and other goods and services that exist downstream. This could pinch consumer spending, delay the Fed’s policy loosening plans, and ultimately disappoint markets.
These are all real possibilities, in my view, and I think it’s possible we see volatility this summer if uncertainty persists—especially given the U.S. presidential election looming in the background. But as I mentioned before, the economy has proven many times over that it can withstand higher oil prices, and I would anticipate that a period of higher prices would only be temporary as it incentivizes more production. Markets will likely anticipate that outcome, too.
To further support your focus on these fundamental principles and enhance your portfolio’s resilience, I am offering our free April 2024 Stock Market Outlook Report5, which gives investors our expert market commentary and the latest forecasts. You’ll receive information on:
• Zacks Rank S&P 500 sector picks
• Current asset allocation guidelines
• Zacks forecasts for the months ahead
• Zacks Rank industry tables
• Buy-side and sell-side consensus at a glance
• And much more!
If you have $500,000 or more to invest and want to learn more about our market forecasts for 2024, click on the link below to get your free report today!
Disclosure
2 Fred Economic Data. April 3, 2024. https://fred.stlouisfed.org/series/DCOILWTICO#
3 Zacks Investment Management reserves the right to amend the terms or rescind the free-Stock Market Outlook Report offer at any time and for any reason at its discretion.
4 Fred Economic Data. April 4, 2024. https://fred.stlouisfed.org/series/DCOILBRENTEU#
5 Zacks Investment Management reserves the right to amend the terms or rescind the free-Stock Market Outlook Report offer at any time and for any reason at its discretion.
DISCLOSURE
Past performance is no guarantee of future results. Inherent in any investment is the potential for loss.
Zacks Investment Management, Inc. is a wholly-owned subsidiary of Zacks Investment Research. Zacks Investment Management is an independent Registered Investment Advisory firm and acts as an investment manager for individuals and institutions. Zacks Investment Research is a provider of earnings data and other financial data to institutions and to individuals.
This material is being provided for informational purposes only and nothing herein constitutes investment, legal, accounting or tax advice, or a recommendation to buy, sell or hold a security. Do not act or rely upon the information and advice given in this publication without seeking the services of competent and professional legal, tax, or accounting counsel. Publication and distribution of this article is not intended to create, and the information contained herein does not constitute, an attorney-client relationship. No recommendation or advice is being given as to whether any investment or strategy is suitable for a particular investor. It should not be assumed that any investments in securities, companies, sectors or markets identified and described were or will be profitable. All information is current as of the date of herein and is subject to change without notice. Any views or opinions expressed may not reflect those of the firm as a whole.
Any projections, targets, or estimates in this report are forward looking statements and are based on the firm’s research, analysis, and assumptions. Due to rapidly changing market conditions and the complexity of investment decisions, supplemental information and other sources may be required to make informed investment decisions based on your individual investment objectives and suitability specifications. All expressions of opinions are subject to change without notice. Clients should seek financial advice regarding the appropriateness of investing in any security or investment strategy discussed in this presentation.
Certain economic and market information contained herein has been obtained from published sources prepared by other parties. Zacks Investment Management does not assume any responsibility for the accuracy or completeness of such information. Further, no third party has assumed responsibility for independently verifying the information contained herein and accordingly no such persons make any representations with respect to the accuracy, completeness or reasonableness of the information provided herein. Unless otherwise indicated, market analysis and conclusions are based upon opinions or assumptions that Zacks Investment Management considers to be reasonable. Any investment inherently involves a high degree of risk, beyond any specific risks discussed herein.
The S&P 500 Index is a well-known, unmanaged index of the prices of 500 large-company common stocks, mainly blue-chip stocks, selected by Standard & Poor’s. The S&P 500 Index assumes reinvestment of dividends but does not reflect advisory fees. The volatility of the benchmark may be materially different from the individual performance obtained by a specific investor. An investor cannot invest directly in an index.
The Russell 1000 Growth Index is a well-known, unmanaged index of the prices of 1000 large-company growth common stocks selected by Russell. The Russell 1000 Growth Index assumes reinvestment of dividends but does not reflect advisory fees. An investor cannot invest directly in an index. The volatility of the benchmark may be materially different from the individual performance obtained by a specific investor.
Nasdaq Composite Index is the market capitalization-weighted index of over 3,300 common equities listed on the Nasdaq stock exchange. The types of securities in the index include American depositary receipts, common stocks, real estate investment trusts (REITs) and tracking stocks, as well as limited partnership interests. The index includes all Nasdaq-listed stocks that are not derivatives, preferred shares, funds, exchange-traded funds (ETFs) or debenture securities. An investor cannot invest directly in an index. The volatility of the benchmark may be materially different from the individual performance obtained by a specific investor.
The Dow Jones Industrial Average measures the daily stock market movements of 30 U.S. publicly-traded companies listed on the NASDAQ or the New York Stock Exchange (NYSE). The 30 publicly-owned companies are considered leaders in the United States economy. An investor cannot directly invest in an index. The volatility of the benchmark may be materially different from the individual performance obtained by a specific investor.
The Bloomberg Global Aggregate Index is a flagship measure of global investment grade debt from twenty-four local currency markets. This multi-currency benchmark includes treasury, government-related, corporate and securitized fixed-rate bonds from both developed and emerging markets issuers. An investor cannot invest directly in an index. The volatility of the benchmark may be materially different from the individual performance obtained by a specific investor.
The ICE Exchange-Listed Fixed & Adjustable Rate Preferred Securities Index is a modified market capitalization weighted index composed of preferred stock and securities that are functionally equivalent to preferred stock including, but not limited to, depositary preferred securities, perpetual subordinated debt and certain securities issued by banks and other financial institutions that are eligible for capital treatment with respect to such instruments akin to that received for issuance of straight preferred stock. An investor cannot invest directly in an index. The volatility of the benchmark may be materially different from the individual performance obtained by a specific investor.
The MSCI ACWI ex U.S. Index captures large and mid-cap representation across 22 of 23 Developed Markets (DM) countries (excluding the United States) and 24 Emerging Markets (EM) countries. The index covers approximately 85% of the global equity opportunity set outside the U.S. An investor cannot invest directly in an index. The volatility of the benchmark may be materially different from the individual performance obtained by a specific investor.
The Russell 2000 Index is a well-known, unmanaged index of the prices of 2000 small-cap company common stocks, selected by Russell. The Russell 2000 Index assumes reinvestment of dividends but does not reflect advisory fees. An investor cannot invest directly in an index. The volatility of the benchmark may be materially different from the individual performance obtained by a specific investor.
The S&P Mid Cap 400 provides investors with a benchmark for mid-sized companies. The index, which is distinct from the large-cap S&P 500, is designed to measure the performance of 400 mid-sized companies, reflecting the distinctive risk and return characteristics of this market segment.
The S&P 500 Pure Value index is a style-concentrated index designed to track the performance of stocks that exhibit the strongest value characteristics by using a style-attractiveness-weighting scheme. An investor cannot directly invest in an index. The volatility of the benchmark may be materially different from the individual performance obtained by a specific investor.