The oil markets were rattled last weekend (and into Monday) when news reports confirmed that Saudi Arabia’s oil giant, Aramco, had suffered attacks at their Abqaiq oil-processing facility. The destruction removed some 5.7 billion barrels a day out of production, which represents approximately half of Saudi Arabia’s total output and nearly 5% of global supply.1
The response in the oil market was nearly instantaneous – the price of Brent crude soared +15% to $69.02 when the market opened on Monday, posting its largest one-day gain since 1988.1
30 years ago, alert investors may have seen this event as an opportunity to enter the energy trade, anticipating that an attack of this size would lead to sustained higher oil and gas prices. And in many cases, they would have probably been right.
But I would argue today that immediate and widespread access to information has made markets far more efficient at pricing these types of supply shock events. The end result, in my view, is a near instantaneous reflection in prices, which totally undermines a strategy of going long energy in the wake of a supply shock.
Another factor that’s much different today than it was 30 years ago is technology. Where an attack of this size may have led to months of supply disruptions in the past, today the recovery times have been narrowed to just days and weeks. Indeed, within a day of the attacks on Aramco, Saudi Arabia’s Energy Minister assured markets that oil output would be fully recovered within weeks, with a target date of the end of September. By Tuesday, Aramco had already restored 50% of lost production, and oil prices retreated back to around $60 a barrel. 1 Trading on the news, in this case, meant only participating in the downside.
______________________________________________________________________________________________
Economic Indicators You Should Keep an Eye On!
Instead of trading on news, I suggest avoiding the urge to get caught up in day-to-day movements, and instead focus on economic data releases, earnings reports, and other economic factors! To help you do this, I am offering all readers a first look into our just-released October 2019 Stock Market Outlook report.
This report will provide you with our forecasts along with additional factors to consider:
- Can a U.S. stock market bounce back this fall?
- Why are Zacks strategists (including me) staying bullish?
- Stock market returns expectations for 2019
- Stock market returns expectations
- What of U.S. GDP Growth?
- Returns for Small, Mid, and Large Cap stocks
- And much more.
If you have $500,000 or more to invest and want to learn more about these forecasts, click on the link below to get your free report today!
IT’S FREE. Download the Just-Released October 2019 Stock Market Outlook2
______________________________________________________________________________________________
The last thing investors must remember is that Saudi Arabia is no longer the world’s largest oil producer. The United States is.3 So, while an attack on a critical oil production facility in Saudi Arabia is no doubt a negative, the United States (and others) have the capability and the supply to keep prices stable – if doing so is the desired result. In this case, the U.S. offered to do just that, but in the end, it wasn’t even necessary.
The United States is the World’s Biggest Oil Producer
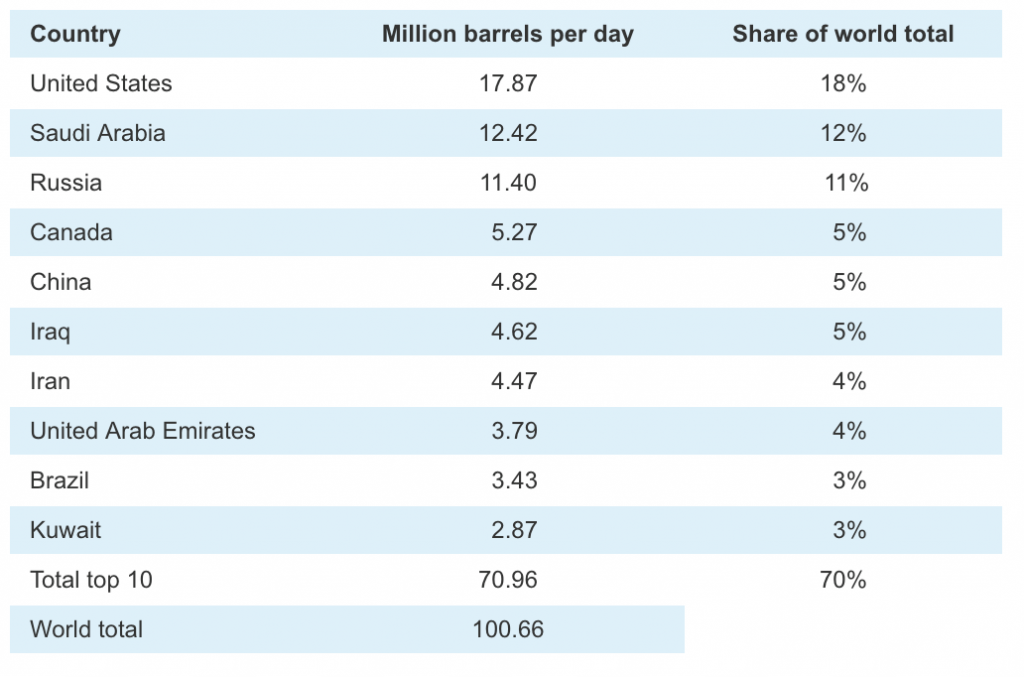
Source: Energy Information Administration3
Another Approach to Energy Investing
Short-term oil shocks make a difference, but long-term supply and demand trends are what drive prices over time, in my view. And that’s where investor focus should be.
When thinking about long-term demand for oil, the key in my view is to look at trends in petroleum and distillate fuel oil consumption. Petroleum is the largest U.S. energy source, and we use petroleum products to propel vehicles, to heat buildings, and to produce electricity.
According to the U.S. Energy Information Administration (EIA), in 2017 the consumption of finished motor gasoline averaged about 392 million gallons per day, which was equal to about 47% of total U.S. petroleum consumption.4
Next in line was diesel fuel, which is used to power diesel engines of heavy construction equipment, trucks, buses, tractors, boats, trains, some automobiles, and electricity generators. The EIA says that total distillate fuel oil consumption in 2017 was equal to about 20% of total U.S. petroleum consumption.4
These two sources of consumption—petroleum and distillate fuel oil—account for nearly two-thirds of U.S. consumption today. The question is, where will it be 10, 20, or even 50 years from now?
Recent trends suggest that long-term investors may want to think about a diversified portfolio of energy companies versus an energy allocation exclusively focused on oil. While I’d venture to say that oil will remain the primary energy source for decades to come, the rise of electric vehicles and falling costs of renewable energy sources are a dual threat to long-term profits in the industry.
As you can see in the chart below, the EIA estimates that liquid fuels (derived from oil) should remain the top source for energy use in the U.S. through 2050, but the biggest leaps in market share come from natural gas and renewables. Oil is no longer the only game in town.
Liquid Fuels May Continue Dominating, but Natural Gas and Renewables Should Gain Market Share Over Time

Source: Energy Information Administration5
Proven reserves for natural gas here in the United States are enormous, and within the renewable energy space, solar and onshore wind turbines saw the largest price declines between 2009 and 2017. Solar panels got 76% cheaper and turbine prices fell 34%, actually making them competitive alternatives to fossil fuels for the first time in history.6
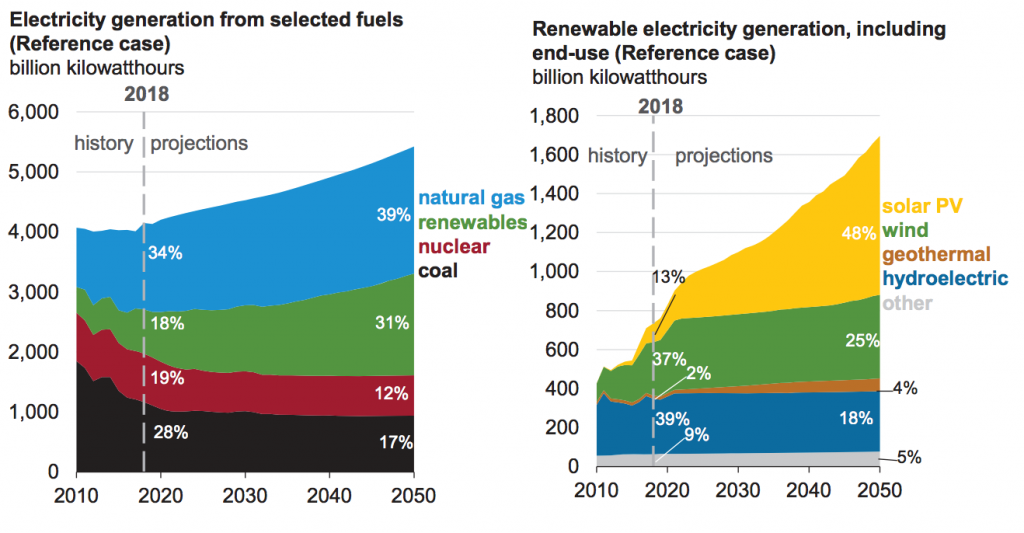
Source: Energy Information Administration6
Bottom Line for Investors
Oil remains on the top of the energy pyramid, and it is likely to remain there for decades to come, in my view. But oil’s position at the top is far from assured over the long term. Investors should continue to watch trends in natural gas, wind, and solar, particularly as natural gas and wind are seen as the two fastest growing energy sources in the U.S.’s energy portfolio. With rapid changes in technology likely to reduce demand for oil, and with natural gas and wind emerging as viable alternatives, a diversified approach to energy investing makes the most sense for long-term investors, in my view.
In addition, I recommend staying focused on the entire market picture instead of trading on the news. To help you do this, I am offering all readers a first-look into our Just-Released October 2019 Stock Market Outlook Report.
This Special Report is packed with our newly revised predictions for 2019. For example, you’ll discover Zacks’ view on:
- For how long will 2019 stay bullish?
- Zacks global markets’ outlook
- What sectors show the best opportunity?
- What industries within those sectors most merit your attention?
- Forecast for the S&P
- Small-cap vs. large-cap returns
- And much more.
If you have $500,000 or more to invest, learn how you may be able to prepare your portfolio for changes in the economy by reading this new report today.7
Disclosure
2 Zacks Investment Management reserves the right to amend the terms or rescind the free Stock Market Outlook offer at any time and for any reason at its discretion.
3 U.S. Energy Information Administration, April 22, 2019. https://www.eia.gov/tools/faqs/faq.php?id=709&t=6
4 U.S. Energy Information Administration, September 28, 2018. https://www.eia.gov/energyexplained/oil-and-petroleum-products/use-of-oil.php
5 U.S. Energy Information Administration, Annual Energy Outlook 2018. https://www.eia.gov/outlooks/aeo/data/browser/#/?id=1-AEO2018®ion=0-0&cases=ref2018&start=2016&end=2050&f=A&linechart=ref2018-d121317a.30-1-AEO2018~ref2018-d121317a.31-1-AEO2018~ref2018-d121317a.32-1-AEO2018~ref2018-d121317a.33-1-AEO2018~ref2018-d121317a.34-1-AEO2018~ref2018-d121317a.35-1-AEO2018~ref2018-d121317a.36-1-AEO2018~ref2018-d121317a.37-1-AEO2018&map=&ctype=linechart&sourcekey=0
6 U.S. Energy Information Administration, Annual Energy Outlook 2019, https://www.eia.gov/outlooks/aeo/pdf/aeo2019.pdf
7 Zacks Investment Management reserves the right to amend the terms or rescind the free Stock Market Outlook offer at any time and for any reason at its discretion.
DISCLOSURE
Past performance is no guarantee of future results. Inherent in any investment is the potential for loss.
Zacks Investment Management, Inc. is a wholly-owned subsidiary of Zacks Investment Research. Zacks Investment Management is an independent Registered Investment Advisory firm and acts as an investment manager for individuals and institutions. Zacks Investment Research is a provider of earnings data and other financial data to institutions and to individuals.
This material is being provided for informational purposes only and nothing herein constitutes investment, legal, accounting or tax advice, or a recommendation to buy, sell or hold a security. Do not act or rely upon the information and advice given in this publication without seeking the services of competent and professional legal, tax, or accounting counsel. Publication and distribution of this article is not intended to create, and the information contained herein does not constitute, an attorney-client relationship. No recommendation or advice is being given as to whether any investment or strategy is suitable for a particular investor. It should not be assumed that any investments in securities, companies, sectors or markets identified and described were or will be profitable. All information is current as of the date of herein and is subject to change without notice. Any views or opinions expressed may not reflect those of the firm as a whole.
Any projections, targets, or estimates in this report are forward looking statements and are based on the firm’s research, analysis, and assumptions. Due to rapidly changing market conditions and the complexity of investment decisions, supplemental information and other sources may be required to make informed investment decisions based on your individual investment objectives and suitability specifications. All expressions of opinions are subject to change without notice. Clients should seek financial advice regarding the appropriateness of investing in any security or investment strategy discussed in this presentation.
Certain economic and market information contained herein has been obtained from published sources prepared by other parties. Zacks Investment Management does not assume any responsibility for the accuracy or completeness of such information. Further, no third party has assumed responsibility for independently verifying the information contained herein and accordingly no such persons make any representations with respect to the accuracy, completeness or reasonableness of the information provided herein. Unless otherwise indicated, market analysis and conclusions are based upon opinions or assumptions that Zacks Investment Management considers to be reasonable. Any investment inherently involves a high degree of risk, beyond any specific risks discussed herein.
It is not possible to invest directly in an index. Investors pursuing a strategy similar to an index may experience higher or lower returns, which will be reduced by fees and expenses.
The S&P 500 Index is a well-known, unmanaged index of the prices of 500 large-company common stocks, mainly blue-chip stocks, selected by Standard & Poor’s. The S&P 500 Index assumes reinvestment of dividends but does not reflect advisory fees. The volatility of the benchmark may be materially different from the individual performance obtained by a specific investor. An investor cannot invest directly in an index.