The stock market has been experiencing heightened volatility of late, which is normal for a host of reasons. Volatility is a regularly occurring feature of equity investing, but it is also common in the early days of a new bull market andin the months leading up to a U.S. presidential election. I encourage investors to remain patient and stay focused on the long-term.
In my view, the economy will continue recovering in the next year, and stocks will respond in kind – with plenty of bumps along the way. But I think there is another reason stocks will feel support over the next year or two, and it has nothing to do with GDP growth or politics or earnings. I think there is another underappreciated factor in play: real bond yields.
For readers who may not be familiar, a ‘real’ bond yield is the interest rate an investor gets paid on a bond, adjusted for inflation. If a 10-year bond pays 5% and inflation grows by 2% annually over that period, the real bond yield is 3%.1 Since inflation cuts into your purchasing power over time, it is important to think about real returns versus nominal returns in the fixed income world.
________________________________________________________________________
Should You Avoid Treasuries and Focus on Stocks?
Real yield on treasuries are not just low, they are negative! So, should you be switching your focus toward stocks? Our just-released stock market outlook report will give you an in-depth look into the current state of treasuries and stocks.
To help you get a deeper look into the current market environment and where could be the best place to invest, we are offering an exclusive look into our just-released October Stock Market Outlook Report.
This report contains some of our key forecasts to consider such as:
- Should you be worried about the 2020 Presidential Election?
- What stocks could go up when vaccine distribution rolls out?
- Signs of recovery in certain sectors
- What of U.S. GDP Growth?
- An update on U.S. fiscal stimulus
- U.S. returns expectations for 2020
- What produces 2020 optimism?
- And much more.
If you have $500,000 or more to invest and want to learn more about these forecasts, click on the link below to get your free report today!
IT’S FREE. Download the Just-Released October 2020 Stock Market Outlook2
________________________________________________________________________
So, if real bond yields are low for intermediate and long-term U.S. Treasuries, we know investors are not being compensated very much for investing in fixed income. Today, however, real bond yields on 10-year U.S. Treasuries are only low, they’re negative. In this environment, investors can reasonably expect to lose money over the life of the bond, when accounting for inflation. As you can see in the chart below, the 10-year Treasure Inflation-Indexed Security is firmly in negative territory, and I think it might stay there for the foreseeable future.
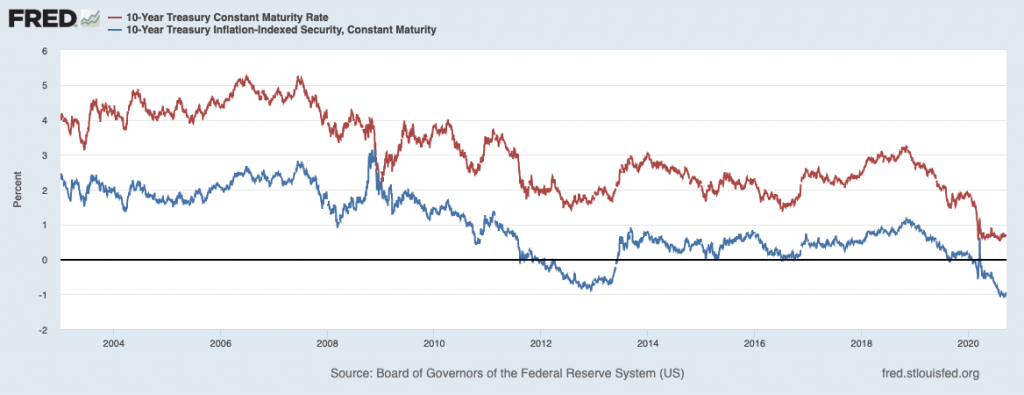
One of the big implications of low or negative real bond yields is the influence they have on other risk assets. If investors know that investing in 10-year U.S. Treasuries means flat or negative real returns, they are likely to look elsewhere for yield – corporate bonds, municipals, and stocks, in my view.
What’s more, the Federal Reserve has made no secret of their medium-term goals for interest rate policy. In a late August speech, Fed Chairman Jerome Powell announced a “flexible form of average inflation targeting,” which is a convoluted way of saying the Fed is now increasingly willing to allow inflation to drift above 2% for “some time.” In other words, investors can expect the Fed to keep interest rates low – and perhaps continue their accommodative asset purchases – even if inflation starts to tick higher. Real bond yields may remain low or negative for an extended period, in my view.
What does this mean for stocks and corporate bonds? On the corporate bond side, the spread between corporate bond yields and U.S. Treasuries is running below its 10-year average. This dynamic is allowing investment-grade corporations to issue an unprecedented amount of bonds to cushion balance sheets and make new investments. But it is also allowing riskier corporations to access the corporate bond market at below-market rates, which investors should be cautious about.
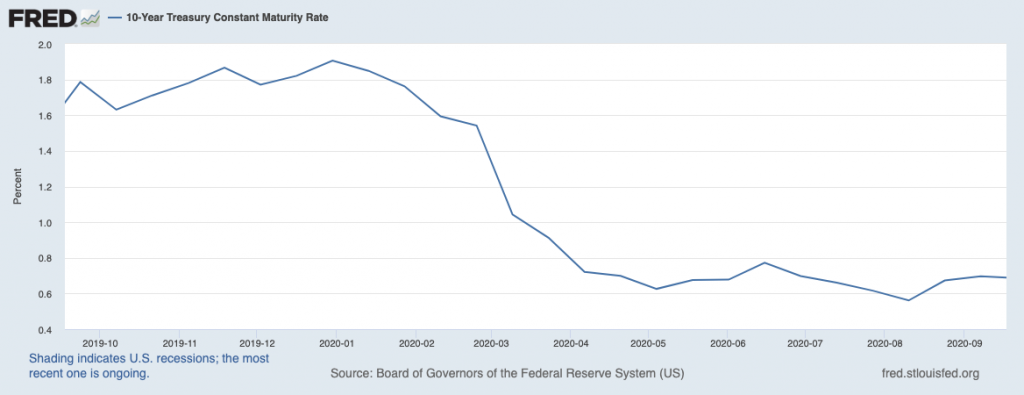
On the equity side, low/negative real bond yields push down the discount rate, making equities attractive relative to bonds. When pricing stocks, a quick method is to consider a corporation’s future earnings potential less the risk-free interest rate – this is the discount rate. A lower discount rate means that future corporate earnings are more valuable, which by extension tends to make stocks more attractive. If the options are to lose money on Treasuries or to own a portion of a company’s future earnings (by owning shares of stock), investors today are being nudged to choose the latter, in my view. As you can see below, the 10-year U.S. Treasury rate has sunk over the last year – boosting the case for equities, in my view.
Bottom Line for Investors
The reality of lower-for-longer interest rates is generally bad news for savers but generally good news for equity investors and borrowers. I have written before that interest rates anchored to the zero bound tend to push investors further out onto the risk curve, particularly those in search of yield. What assets are out on the risk curve ready to receive this rotating capital? Stocks and corporate bonds, in my view.
To learn more about stocks, bonds and another key data points that can help you navigate this current market, I am offering all readers our Just-Released October 2020 Stock Market Outlook Report.
This Special Report is packed with newly revised predictions that can help you base your next investment move on hard data. For example, you’ll discover Zacks’ view on:
- Should you be worried about the 2020 Presidential Election?
- What stocks could go up when vaccine distribution rolls out?
- Signs of recovery in certain sectors
- What of U.S. GDP Growth?
- An update on U.S. fiscal stimulus
- U.S. returns expectations for 2020
- What produces 2020 optimism?
- And much more.
If you have $500,000 or more to invest and want to learn more about these forecasts, click on the link below to get your free report today!5
Disclosure
2 Zacks Investment Management reserves the right to amend the terms or rescind the free Stock Market Outlook offer at any time and for any reason at its discretion.
3 Dow Jones & Company and Haver Analytics, 10-Year 0.875% Treasury Inflation-Indexed Note, Due 1/15/2029 [DTP10J29], retrieved from FRED, Federal Reserve Bank of St. Louis; https://fred.stlouisfed.org/series/DTP10J29, September 22, 2020.
4 Board of Governors of the Federal Reserve System (US), 10-Year Treasury Constant Maturity Rate [DGS10], retrieved from FRED, Federal Reserve Bank of St. Louis; https://fred.stlouisfed.org/series/DGS10, September 21, 2020.
5 Zacks Investment Management reserves the right to amend the terms or rescind the free Stock Market Outlook offer at any time and for any reason at its discretion.
DISCLOSURE
Past performance is no guarantee of future results. Inherent in any investment is the potential for loss.
Zacks Investment Management, Inc. is a wholly-owned subsidiary of Zacks Investment Research. Zacks Investment Management is an independent Registered Investment Advisory firm and acts as an investment manager for individuals and institutions. Zacks Investment Research is a provider of earnings data and other financial data to institutions and to individuals.
This material is being provided for informational purposes only and nothing herein constitutes investment, legal, accounting or tax advice, or a recommendation to buy, sell or hold a security. Do not act or rely upon the information and advice given in this publication without seeking the services of competent and professional legal, tax, or accounting counsel. Publication and distribution of this article is not intended to create, and the information contained herein does not constitute, an attorney-client relationship. No recommendation or advice is being given as to whether any investment or strategy is suitable for a particular investor. It should not be assumed that any investments in securities, companies, sectors or markets identified and described were or will be profitable. All information is current as of the date of herein and is subject to change without notice. Any views or opinions expressed may not reflect those of the firm as a whole.
Any projections, targets, or estimates in this report are forward looking statements and are based on the firm’s research, analysis, and assumptions. Due to rapidly changing market conditions and the complexity of investment decisions, supplemental information and other sources may be required to make informed investment decisions based on your individual investment objectives and suitability specifications. All expressions of opinions are subject to change without notice. Clients should seek financial advice regarding the appropriateness of investing in any security or investment strategy discussed in this presentation.
Certain economic and market information contained herein has been obtained from published sources prepared by other parties. Zacks Investment Management does not assume any responsibility for the accuracy or completeness of such information. Further, no third party has assumed responsibility for independently verifying the information contained herein and accordingly no such persons make any representations with respect to the accuracy, completeness or reasonableness of the information provided herein. Unless otherwise indicated, market analysis and conclusions are based upon opinions or assumptions that Zacks Investment Management considers to be reasonable. Any investment inherently involves a high degree of risk, beyond any specific risks discussed herein.
The S&P 500 Index is a well-known, unmanaged index of the prices of 500 large-company common stocks, mainly blue-chip stocks, selected by Standard & Poor’s. The S&P 500 Index assumes reinvestment of dividends but does not reflect advisory fees. The volatility of the benchmark may be materially different from the individual performance obtained by a specific investor. An investor cannot invest directly in an index.
The Russell 1000 Growth Index is a well-known, unmanaged index of the prices of 1000 large-company growth common stocks selected by Russell. The Russell 1000 Growth Index assumes reinvestment of dividends but does not reflect advisory fees. An investor cannot invest directly in an index. The volatility of the benchmark may be materially different from the individual performance obtained by a specific investor.
Nasdaq Composite Index is the market capitalization-weighted index of over 3,300 common equities listed on the Nasdaq stock exchange. The types of securities in the index include American depositary receipts, common stocks, real estate investment trusts (REITs) and tracking stocks, as well as limited partnership interests. The index includes all Nasdaq-listed stocks that are not derivatives, preferred shares, funds, exchange-traded funds (ETFs) or debenture securities. An investor cannot invest directly in an index. The volatility of the benchmark may be materially different from the individual performance obtained by a specific investor.
The VIX Index is a calculation designed to produce a measure of constant, 30-day expected volatility of the U.S. stock market, derived from real-time, mid-quote prices of S&P 500® Index (SPXSM) call and put options. On a global basis, it is one of the most recognized measures of volatility -- widely reported by financial media and closely followed by a variety of market participants as a daily market indicator. An investor cannot invest directly in an index. The volatility of the benchmark may be materially different from the individual performance obtained by a specific investor.