According to a survey conducted in November, there were approximately 11 million available jobs in the United States, compared to 6.9 million unemployed people actively looking for work. Opportunities for Americans looking for work or looking for a job change are many, and it’s also arguably a great time to negotiate higher wages and sign-on bonuses. Indeed, a recent survey by the Conference Board found that U.S. companies are setting aside an average of 3.9% of total payroll for wage increases in 2022.
Retail spending has also been strong – the National Retail Federation expects that U.S. November-December retail sales will jump by approximately 10% from a year ago, bringing the total to as much as $850 billion or more.1
Finally, household finances are also in solid shape, in aggregate. Many households saved and paid down debt over the course of the pandemic, and total U.S. household net worth was up to $2.4 trillion by the end of the third quarter.2 By these fundamental measures, the economy appears to be in great shape.
Yet few Americans are happy about it. ___________________________________________________________________________
Bearish Sentiment Does Not Mean a Bearish Future
The economy has experienced many ups and downs this year and investors are skeptical of where we stand for the new year. Are we in a good space? What can investors make of this market?
During times like these, it is important not to get caught up in negative headlines. Instead, my recommendation is to base your investing decisions on economic data releases, earnings reports, and other economic factors!
To help you do this, we are offering all readers a look into our just-released January 2021 Stock Market Outlook report.
This report will provide you with our forecasts along with additional factors to consider:
- Zacks rank S&P 500 sector picks
- Zacks view on equity markets
- What produces optimism?
- Zacks forecasts for the remainder of the year
- Zacks ranks industry tables
- Sell-side and buy-side consensus
- And much more
If you have $500,000 or more to invest and want to learn more about these forecasts, click on the link below to get your free report today!
IT’S FREE. Download the Just-Released January 2022 Stock Market Outlook3
___________________________________________________________________________
In a recent poll conducted by the Associated Press, 64% of respondents described their finances as good, but only 35% felt the U.S. economy was in good shape. In October, the Gallup Economic Confidence Index dropped to levels last seen in April 20204 – when the global economy was in lockdown.
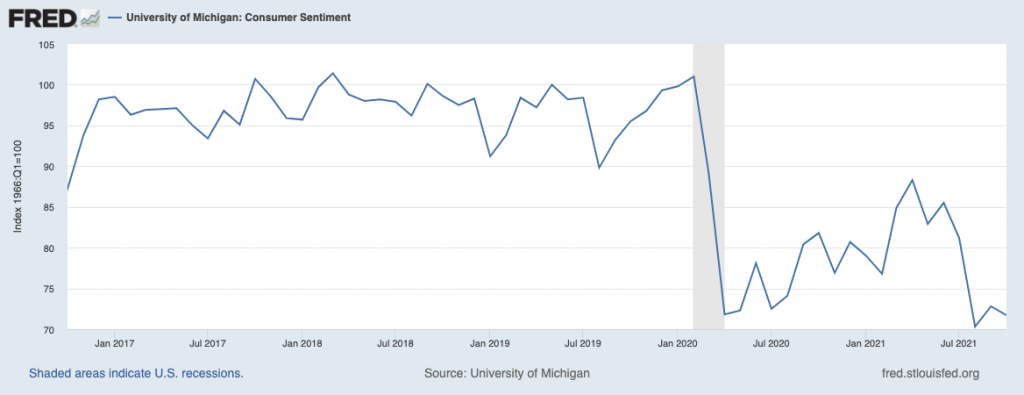
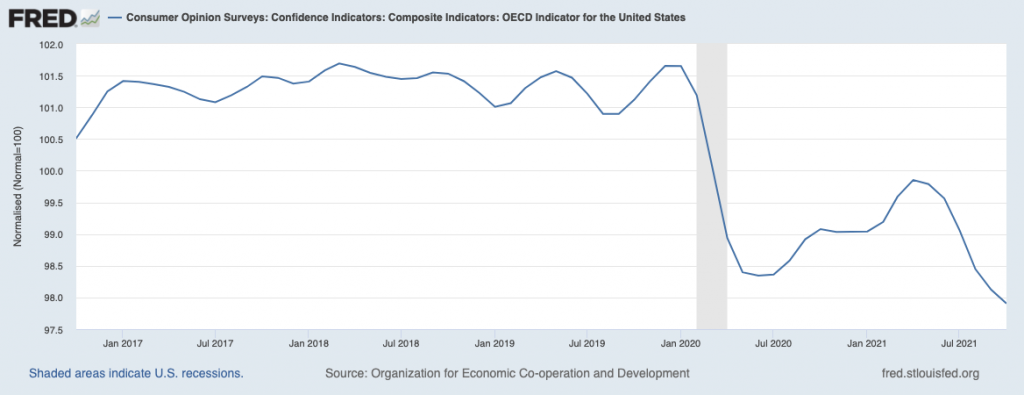
Two closely watched consumer sentiment measures – the University of Michigan index and the OECD confidence survey – both show a fairly steep decline in sentiment starting in the spring of 2021, with virtually no recovery since.
University of Michigan Consumer Sentiment
OECD Consumer Confidence Survey
Investors have followed a similar pattern. According to the American Association of Individual Investors (AAII), the past month indicates more bearish investors than bullish ones when looking out at the next six months.7
In short, there isn’t much love for the U.S. economic recovery, and the reasons why are likely obvious to many readers – supply chain disruptions, worker shortages, and rising prices for food and energy have pushed inflation to a 39-year high.8 Many services in the U.S. economy – from air travel to restaurants and hospitality – do not work as smoothly as they used to. Workers have not returned to offices, and folks spend less time socializing. A sense of normalcy remains elusive.
According to the survey director of the University of Michigan Consumer Sentiment index, Richard Curtin, persistently low consumer sentiment “reflects an emotional response, mainly from dashed hopes that the pandemic would soon end.”9 Non-stop coverage of supply chain disruptions and inflation pressures likely do not help boost sentiment either, in my view.
So, what does the somewhat dour consumer and investor mood mean for equity markets?
Probably that there is more runway for the bull market, in my view. The worst sign for stocks is when euphoria and greed grip investors and the headlines, e.g., when everyone is focused on how well stocks are doing and how much further up they’re likely to go. We are not seeing these signs today, and I would argue that inflation and Omicron variant worries have arguably tilted sentiment back into outright negative territory. Anchored sentiment can lead to short-term volatility, but looking further ahead, I think it’s a sign the wall of worry is still growing. And I view that as a positive forward indicator for stocks.
Bottom Line for Investors
The economy is largely in strong shape, but most people are unhappy about it. Indeed, what started as a year of investor and consumer enthusiasm for an economic boom has largely faded into a broad feeling of concern and disappointment. Some of the frothy signs I noticed at the beginning of the year – the SPAC boom, retail investors pouring into “meme stocks” and cryptocurrencies, etc. – have lost their luster, and the sentiment scales appear to be tipping firmly back into negative territory. Taken together, I think that means we have a very unloved economic expansion and bull market, which is usually good news for stocks.
To help you keep a close eye on key factors that shape the economy, I am offering all readers our Just-Released January 2022 Stock Market Outlook Report.
This Special Report is packed with newly revised predictions to consider for 2022 that can help you base your next investment move on hard data. For example, you’ll discover Zacks’ view on:
- Zacks rank S&P 500 sector picks
- Zacks view on equity markets
- What produces optimism?
- Zacks forecasts for the remainder of the year
- Zacks ranks industry tables
- Sell-side and buy-side consensus
- And much more
If you have $500,000 or more to invest and want to learn more about these forecasts, click on the link below to get your free report today!
Disclosure
2 Market Watch. December 11, 2021. https://www.marketwatch.com/story/u-s-household-net-worth-increases-in-sixth-straight-quarter-fed-data-show-11639075876
3 Zacks Investment Management reserves the right to amend the terms or rescind the free Stock Market Outlook offer at any time and for any reason at its discretion.
4 Gallup News. October 27, 2021. https://news.gallup.com/poll/356672/job-market-ratings-set-record-economic-confidence-slides.aspx
5 Fred Economic Data. November 24, 2021. https://fred.stlouisfed.org/series/UMCSENT
6 Fred Economic Data. November 12, 2021. https://fred.stlouisfed.org/series/CSCICP03USM665S
7 American Association of Individual Investors. December 9, 2021. https://www.aaii.com/sentimentsurvey
8 Barron’s. December 11, 2021. https://www.barrons.com/articles/stock-market-inflation-federal-reserve-51639184794
9 Bloomberg. November 5, 2021. https://www.bloomberg.com/opinion/articles/2021-11-05/u-s-economic-boom-isn-t-making-americans-happy?campaign_id=9&emc=edit_nn_20211210&instance_id=47462&nl=the-morning®i_id=73232473&segment_id=76615&te=1&user_id=6509608d7d654ad83dc4a4bbba63f920
10 Zacks Investment Management reserves the right to amend the terms or rescind the free Stock Market Outlook offer at any time and for any reason at its discretion.
DISCLOSURE
Past performance is no guarantee of future results. Inherent in any investment is the potential for loss.
Zacks Investment Management, Inc. is a wholly-owned subsidiary of Zacks Investment Research. Zacks Investment Management is an independent Registered Investment Advisory firm and acts as an investment manager for individuals and institutions. Zacks Investment Research is a provider of earnings data and other financial data to institutions and to individuals.
This material is being provided for informational purposes only and nothing herein constitutes investment, legal, accounting or tax advice, or a recommendation to buy, sell or hold a security. Do not act or rely upon the information and advice given in this publication without seeking the services of competent and professional legal, tax, or accounting counsel. Publication and distribution of this article is not intended to create, and the information contained herein does not constitute, an attorney-client relationship. No recommendation or advice is being given as to whether any investment or strategy is suitable for a particular investor. It should not be assumed that any investments in securities, companies, sectors or markets identified and described were or will be profitable. All information is current as of the date of herein and is subject to change without notice. Any views or opinions expressed may not reflect those of the firm as a whole.
Any projections, targets, or estimates in this report are forward looking statements and are based on the firm’s research, analysis, and assumptions. Due to rapidly changing market conditions and the complexity of investment decisions, supplemental information and other sources may be required to make informed investment decisions based on your individual investment objectives and suitability specifications. All expressions of opinions are subject to change without notice. Clients should seek financial advice regarding the appropriateness of investing in any security or investment strategy discussed in this presentation.
Certain economic and market information contained herein has been obtained from published sources prepared by other parties. Zacks Investment Management does not assume any responsibility for the accuracy or completeness of such information. Further, no third party has assumed responsibility for independently verifying the information contained herein and accordingly no such persons make any representations with respect to the accuracy, completeness or reasonableness of the information provided herein. Unless otherwise indicated, market analysis and conclusions are based upon opinions or assumptions that Zacks Investment Management considers to be reasonable. Any investment inherently involves a high degree of risk, beyond any specific risks discussed herein.
The S&P 500 Index is a well-known, unmanaged index of the prices of 500 large-company common stocks, mainly blue-chip stocks, selected by Standard & Poor’s. The S&P 500 Index assumes reinvestment of dividends but does not reflect advisory fees. The volatility of the benchmark may be materially different from the individual performance obtained by a specific investor. An investor cannot invest directly in an index.
The Russell 1000 Growth Index is a well-known, unmanaged index of the prices of 1000 large-company growth common stocks selected by Russell. The Russell 1000 Growth Index assumes reinvestment of dividends but does not reflect advisory fees. An investor cannot invest directly in an index. The volatility of the benchmark may be materially different from the individual performance obtained by a specific investor.
Nasdaq Composite Index is the market capitalization-weighted index of over 3,300 common equities listed on the Nasdaq stock exchange. The types of securities in the index include American depositary receipts, common stocks, real estate investment trusts (REITs) and tracking stocks, as well as limited partnership interests. The index includes all Nasdaq-listed stocks that are not derivatives, preferred shares, funds, exchange-traded funds (ETFs) or debenture securities. An investor cannot invest directly in an index. The volatility of the benchmark may be materially different from the individual performance obtained by a specific investor.
The Dow Jones Industrial Average measures the daily stock market movements of 30 U.S. publicly-traded companies listed on the NASDAQ or the New York Stock Exchange (NYSE). The 30 publicly-owned companies are considered leaders in the United States economy. An investor cannot directly invest in an index. The volatility of the benchmark may be materially different from the individual performance obtained by a specific investor.