Last week, the White House and Republican leadership in the House announced they had reached a deal on the debt ceiling. Days later, the House passed the measure by a fairly convincing and bipartisan vote tally of 314 – 117, and the Senate passed it the following day with a vote of 63-46. In recent columns covering this issue, I made clear my view that the likelihood of an actual debt default was very low, and also my firm conviction that a deal would ultimately get done. Here we are.
Some members of both parties still oppose the deal, and we’re likely to see more posturing against its passage even after it’s signed into law. I wouldn’t lose sleep over it. Markets are already looking well past the debt ceiling issue, and I think investors should too.1
I’ll review some of the key details of the deal below. But my main focus this week is to imprint on readers how the debt ceiling drama—while causing much distress in the media and worry amongst everyday investors—has consistently proven to be a “looming catastrophe of global proportions” that simply never comes to fruition. In the future, investors might be best suited to ignore these debt ceiling flare-ups altogether.2
Some readers may note that while the U.S. will not miss any obligations or debt payments in this instance, there is still the possibility of a credit downgrade from one of the rating agencies like Fitch, Standard & Poor’s, and/or Moody’s. That’s possible, especially considering Fitch’s recent press release indicating that the U.S. was on watch for a potential downgrade from its sterling AAA credit rating.
The question is whether a credit downgrade matters all that much.
For individuals, when your credit score goes down, it can have meaningful effects on whether you’re extended credit and how much borrowed money costs – think about your mortgage rates, credit card interest rates, auto loan rates, etc.
For developed countries, however, a slight credit downgrade has historically been much less meaningful. The ‘fiscal cliff’ fiasco of 2011 offers a recent example. A major headline in that period was Standard & Poor’s downgrading the U.S.’s debt rating from AAA to AA+, which felt like a huge deal at the time. One would think that a debt downgrade would put upward pressure on the cost of borrowing, which in the case of the U.S., would mean higher yields on U.S. Treasuries.
But as the chart below shows, the opposite happened.
Yield on 10-Year U.S. Treasury Bond (2011)
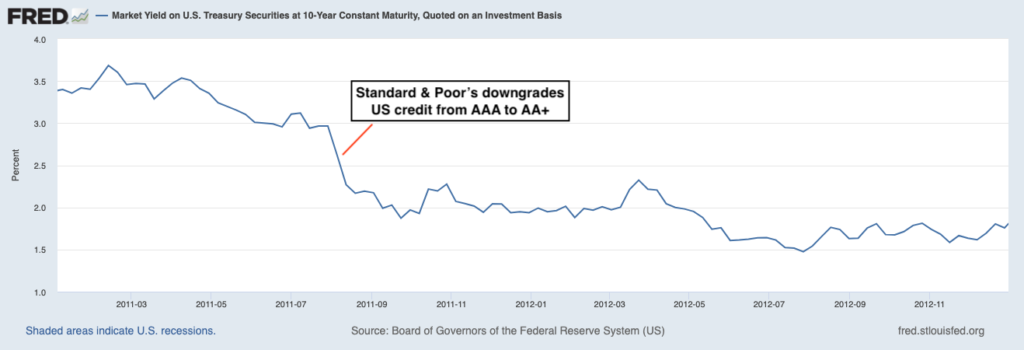
Source: Federal Reserve Bank of St. Louis3
When Standard & Poor’s downgraded the U.S.’s debt rating, yields on the 10-year U.S. Treasury bonds went down – not up. In other words, the cost of borrowing got cheaper for the U.S. in the wake of the rating agency’s wrist-slap.
The same has been true for other developed countries like Japan and the UK when rating agencies have issued downgrades. Yields did not uniformly go down in every case, but in the instances when yields rose, they did so by fairly marginal amounts. In short, downgrades have not had much impact on developed countries’ ability to borrow.
It’s also worth remembering that rating agencies arguably lack credibility in financial markets. Back in the spring of 2008, Fitch gave Lehman Brothers’ preferred stock an A+ rating just a month after Bear Sterns failed. Lehman would go under just five months later. Fast forward to today, and Fitch says that the U.S. missing a debt payment is a “very low probability event,” while at the same time warning of a possible downgrade. This stuff just isn’t worth investors’ time.
Bottom Line for Investors
The deal on the debt ceiling would suspend the U.S.’s borrowing limit for two years while cutting a few spending programs and increasing military spending by 3%. One concern of markets was that the deal would make significant cuts to government spending, which factors into GDP growth calculations. But those worries have largely been abated, as estimates say the deal would reduce federal spending by about 0.2% of GDP through 2025.
You read that last sentence correctly – all of the drama and hand-wringing over the debt ceiling for a marginal reduction in overall spending, which does not deviate meaningfully from baseline long-term forecasts. As I’ve written before, I don’t think the debt ceiling is worth investors’ time. In a few weeks’ time, no one will be talking about it anyway.
Disclosure
2 Wall Street Journal. May 30, 2023. https://www.wsj.com/articles/debt-ceiling-deal-does-little-to-change-direction-of-federal-spending-economy-d613388
3 Fred Economic Data. May 30, 2023. https://fred.stlouisfed.org/series/DGS10#
DISCLOSURE
Past performance is no guarantee of future results. Inherent in any investment is the potential for loss.
Zacks Investment Management, Inc. is a wholly-owned subsidiary of Zacks Investment Research. Zacks Investment Management is an independent Registered Investment Advisory firm and acts as an investment manager for individuals and institutions. Zacks Investment Research is a provider of earnings data and other financial data to institutions and to individuals.
This material is being provided for informational purposes only and nothing herein constitutes investment, legal, accounting or tax advice, or a recommendation to buy, sell or hold a security. Do not act or rely upon the information and advice given in this publication without seeking the services of competent and professional legal, tax, or accounting counsel. Publication and distribution of this article is not intended to create, and the information contained herein does not constitute, an attorney-client relationship. No recommendation or advice is being given as to whether any investment or strategy is suitable for a particular investor. It should not be assumed that any investments in securities, companies, sectors or markets identified and described were or will be profitable. All information is current as of the date of herein and is subject to change without notice. Any views or opinions expressed may not reflect those of the firm as a whole.
Any projections, targets, or estimates in this report are forward looking statements and are based on the firm’s research, analysis, and assumptions. Due to rapidly changing market conditions and the complexity of investment decisions, supplemental information and other sources may be required to make informed investment decisions based on your individual investment objectives and suitability specifications. All expressions of opinions are subject to change without notice. Clients should seek financial advice regarding the appropriateness of investing in any security or investment strategy discussed in this presentation.
Certain economic and market information contained herein has been obtained from published sources prepared by other parties. Zacks Investment Management does not assume any responsibility for the accuracy or completeness of such information. Further, no third party has assumed responsibility for independently verifying the information contained herein and accordingly no such persons make any representations with respect to the accuracy, completeness or reasonableness of the information provided herein. Unless otherwise indicated, market analysis and conclusions are based upon opinions or assumptions that Zacks Investment Management considers to be reasonable. Any investment inherently involves a high degree of risk, beyond any specific risks discussed herein.
The S&P 500 Index is a well-known, unmanaged index of the prices of 500 large-company common stocks, mainly blue-chip stocks, selected by Standard & Poor’s. The S&P 500 Index assumes reinvestment of dividends but does not reflect advisory fees. The volatility of the benchmark may be materially different from the individual performance obtained by a specific investor. An investor cannot invest directly in an index.
The Russell 1000 Growth Index is a well-known, unmanaged index of the prices of 1000 large-company growth common stocks selected by Russell. The Russell 1000 Growth Index assumes reinvestment of dividends but does not reflect advisory fees. An investor cannot invest directly in an index. The volatility of the benchmark may be materially different from the individual performance obtained by a specific investor.
Nasdaq Composite Index is the market capitalization-weighted index of over 3,300 common equities listed on the Nasdaq stock exchange. The types of securities in the index include American depositary receipts, common stocks, real estate investment trusts (REITs) and tracking stocks, as well as limited partnership interests. The index includes all Nasdaq-listed stocks that are not derivatives, preferred shares, funds, exchange-traded funds (ETFs) or debenture securities. An investor cannot invest directly in an index. The volatility of the benchmark may be materially different from the individual performance obtained by a specific investor.
The Dow Jones Industrial Average measures the daily stock market movements of 30 U.S. publicly-traded companies listed on the NASDAQ or the New York Stock Exchange (NYSE). The 30 publicly-owned companies are considered leaders in the United States economy. An investor cannot directly invest in an index. The volatility of the benchmark may be materially different from the individual performance obtained by a specific investor.
The Bloomberg Global Aggregate Index is a flagship measure of global investment grade debt from twenty-four local currency markets. This multi-currency benchmark includes treasury, government-related, corporate and securitized fixed-rate bonds from both developed and emerging markets issuers. An investor cannot invest directly in an index. The volatility of the benchmark may be materially different from the individual performance obtained by a specific investor.
The ICE Exchange-Listed Fixed & Adjustable Rate Preferred Securities Index is a modified market capitalization weighted index composed of preferred stock and securities that are functionally equivalent to preferred stock including, but not limited to, depositary preferred securities, perpetual subordinated debt and certain securities issued by banks and other financial institutions that are eligible for capital treatment with respect to such instruments akin to that received for issuance of straight preferred stock. An investor cannot invest directly in an index. The volatility of the benchmark may be materially different from the individual performance obtained by a specific investor.
The MSCI ACWI ex U.S. Index captures large and mid-cap representation across 22 of 23 Developed Markets (DM) countries (excluding the United States) and 24 Emerging Markets (EM) countries. The index covers approximately 85% of the global equity opportunity set outside the U.S. An investor cannot invest directly in an index. The volatility of the benchmark may be materially different from the individual performance obtained by a specific investor.