U.S. Households Remain Pessimistic About the Economy – That’s Bullish
A handful of surveys released over the past few weeks reveal a common theme: American households remain skeptical about the overall health of the economy.
One such survey was released last week by the credit-reporting firm TransUnion, which showed that Americans are more concerned about inflation and interest rates today than they have been in over two years. About 50% of TransUnion’s survey respondents said that high interest rates were among their top three financial concerns, with 84% saying that higher prices for gas, groceries, and other everyday goods were impacting household budgets negatively.1
We know from the consumer price index (CPI) and personal consumption expenditures (PCE) that inflation peaked in June 2022 and has been steadily improving since. But consumers don’t see it that way. Many households do not differentiate between price and inflation, which means that many continue to see inflation as a problem that keeps getting worse—not better.2
Get Our Election Year Insights!
As the election approaches, many investors are wondering how it will affect the market. This particular election is stirring strong opinions across the political spectrum, with emotions running high.
From an investment standpoint, it’s important to “set aside political views” and concentrate on fundamentals and data. To assist with this, we have created our special Stock Market Outlook Report3, focusing on election year insights. This report includes expert analysis, detailed forecasts, and more:
• Expert Market Strategy Commentary
• Zacks Sector Picks
• Key U.S. Economic Data
• Global Market Data
• Zacks S&P 500 Earnings Insights
If you have $500,000 or more to invest, request our free Stock Market Outlook Special Report3 today!
Download Our Stock Market Outlook Special Report: Election Year Insights
Another survey conducted by business intelligence company Morning Consult supports this point. They found that less than half of Americans identified inflation as the rate of change of rising prices for goods and services. Instead, inflation just means ‘higher prices,’ which is why 69% of respondents to Morning Consult’s survey said that inflation was higher today than it was a year ago. We know from the data that this is not factually correct.
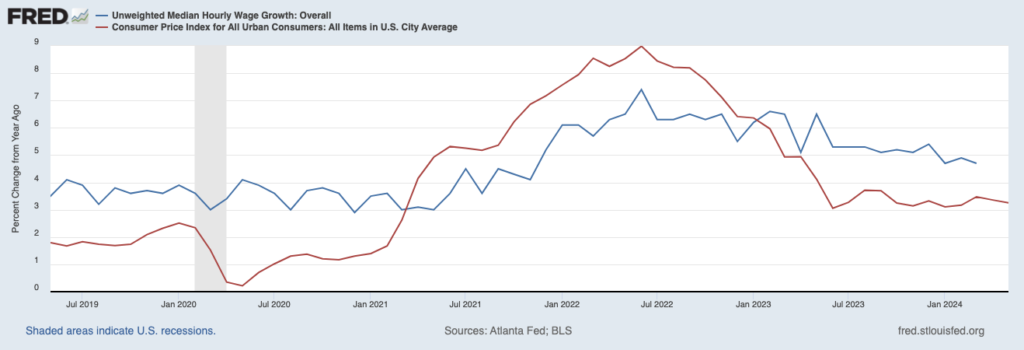
Misunderstanding inflation is a key reason why investor and consumer sentiment remain relatively low. Nearly half of Americans think that inflation is outpacing income growth, which as seen in the chart below, has not been the case (in aggregate across the economy) in recent months:
Median Year-over-Year (%) Wage Growth (blue line) has Outpaced Inflation Since 2023
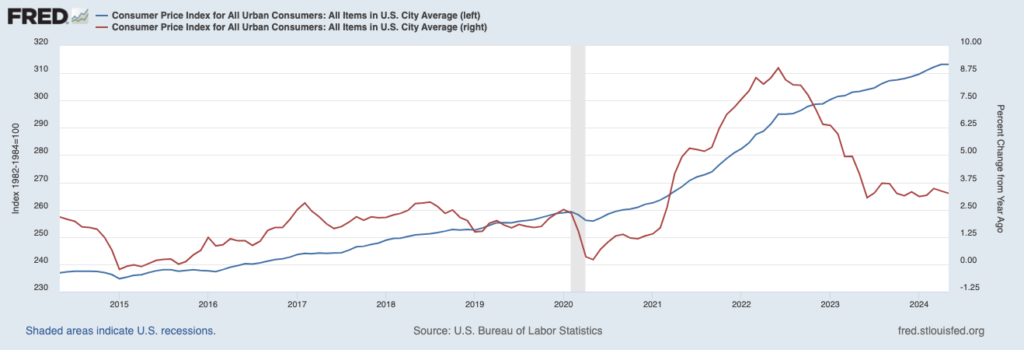
All told, only about a quarter of Americans define inflation as the rise in prices over the past year. Most households experience inflation as presented in the chart below—they see the blue line, which shows consumer prices moving ever higher on a nominal basis, even though the rate of change has been improving. The chart below looks at the same data—consumer price index for all items in the U.S.—in different terms. The blue line shows prices indexed to levels from 40 years ago, while the red line shows the year-over-year percentage change. Economists and the Federal Reserve focus on the red line when making projections and setting policy. Consumers tend to experience the blue line.
Consumer Price Index (CPI) for All Items in the U.S.
Then there’s consumer sentiment as measured by the University of Michigan’s popular index. In a preliminary estimate from early June, the University of Michigan’s consumer sentiment index fell to 65.6 from May’s 69.1 reading, which was well below economist expectations for sentiment to improve to 72.0. A separate gauge of consumer sentiment surrounding personal finance also fell to its lowest level since October 2023, and consumers also expressed concern about broad economic conditions. These concerns seem to be growing alongside the growing economy.
In my view, the picture that emerges of concerned, largely skeptical U.S. households is bullish for equity markets. It highlights a disconnect between economic fundamentals and sentiment about the economy, which over time I’ve tended to identify as part of the ‘wall of worry’ that stocks like to climb.
A case-in-point comes from the TransUnion survey. U.S. households expressed high levels of concern about interest rates and inflation, but they also reported optimism about personal finances given the stable jobs market and wage increases over the past year. It is almost as if to say, “the economy is in trouble, but our personal situation has been improving.”
The reality—as evidenced by the economic data we track closely—is that the economy and household balance sheets are both getting better at the same time, which is also why I think the stock market has been rallying this year.
Bottom Line for Investors
John Templeton famously said that “bull markets are born on pessimism, grow on skepticism, mature on optimism and die on euphoria.” Measures of consumer and investor sentiment, as detailed above, indicate that there’s still plenty of skepticism about the economy and markets—even as fundamentals tell a different story. This disconnect, which is also an indication that the U.S. economy and corporate profitability are being underappreciated, keeps me optimistic about this bull market having more room to run.
If you’re also wondering how the upcoming election will impact the market’s direction, I recommend downloading our free Stock Market Outlook Report6. This report focuses on current election insights and includes expert analysis, detailed forecasts, and more including:
• Expert Market Strategy Commentary
• Zacks Sector Picks
• Key U.S. Economic Data
• Global Market Data
• Zacks S&P 500 Earnings Insights
If you have $500,000 or more to invest, request our free Stock Market Outlook Special Report6 today!
Disclosure
2 Yahoo Finance. June 14, 2024. https://finance.yahoo.com/news/us-consumer-sentiment-unexpectedly-falls-141504234.html
3 Zacks Investment Management reserves the right to amend the terms or rescind the free-Stock Market Outlook Report offer at any time and for any reason at its discretion.
4 Fred Economic Data. April 10, 2024. https://fred.stlouisfed.org/series/FRBATLWGTUMHWGO#
5 Fred Economic Data. June 12, 2024. https://fred.stlouisfed.org/series/CPIAUCSL#
6 Zacks Investment Management reserves the right to amend the terms or rescind the free-Stock Market Outlook Report offer at any time and for any reason at its discretion.
DISCLOSURE
Past performance is no guarantee of future results. Inherent in any investment is the potential for loss.
Zacks Investment Management, Inc. is a wholly-owned subsidiary of Zacks Investment Research. Zacks Investment Management is an independent Registered Investment Advisory firm and acts as an investment manager for individuals and institutions. Zacks Investment Research is a provider of earnings data and other financial data to institutions and to individuals.
This material is being provided for informational purposes only and nothing herein constitutes investment, legal, accounting or tax advice, or a recommendation to buy, sell or hold a security. Do not act or rely upon the information and advice given in this publication without seeking the services of competent and professional legal, tax, or accounting counsel. Publication and distribution of this article is not intended to create, and the information contained herein does not constitute, an attorney-client relationship. No recommendation or advice is being given as to whether any investment or strategy is suitable for a particular investor. It should not be assumed that any investments in securities, companies, sectors or markets identified and described were or will be profitable. All information is current as of the date of herein and is subject to change without notice. Any views or opinions expressed may not reflect those of the firm as a whole.
Any projections, targets, or estimates in this report are forward looking statements and are based on the firm’s research, analysis, and assumptions. Due to rapidly changing market conditions and the complexity of investment decisions, supplemental information and other sources may be required to make informed investment decisions based on your individual investment objectives and suitability specifications. All expressions of opinions are subject to change without notice. Clients should seek financial advice regarding the appropriateness of investing in any security or investment strategy discussed in this presentation.
Certain economic and market information contained herein has been obtained from published sources prepared by other parties. Zacks Investment Management does not assume any responsibility for the accuracy or completeness of such information. Further, no third party has assumed responsibility for independently verifying the information contained herein and accordingly no such persons make any representations with respect to the accuracy, completeness or reasonableness of the information provided herein. Unless otherwise indicated, market analysis and conclusions are based upon opinions or assumptions that Zacks Investment Management considers to be reasonable. Any investment inherently involves a high degree of risk, beyond any specific risks discussed herein.
The S&P 500 Index is a well-known, unmanaged index of the prices of 500 large-company common stocks, mainly blue-chip stocks, selected by Standard & Poor’s. The S&P 500 Index assumes reinvestment of dividends but does not reflect advisory fees. The volatility of the benchmark may be materially different from the individual performance obtained by a specific investor. An investor cannot invest directly in an index.
The Russell 1000 Growth Index is a well-known, unmanaged index of the prices of 1000 large-company growth common stocks selected by Russell. The Russell 1000 Growth Index assumes reinvestment of dividends but does not reflect advisory fees. An investor cannot invest directly in an index. The volatility of the benchmark may be materially different from the individual performance obtained by a specific investor.
Nasdaq Composite Index is the market capitalization-weighted index of over 3,300 common equities listed on the Nasdaq stock exchange. The types of securities in the index include American depositary receipts, common stocks, real estate investment trusts (REITs) and tracking stocks, as well as limited partnership interests. The index includes all Nasdaq-listed stocks that are not derivatives, preferred shares, funds, exchange-traded funds (ETFs) or debenture securities. An investor cannot invest directly in an index. The volatility of the benchmark may be materially different from the individual performance obtained by a specific investor.
The Dow Jones Industrial Average measures the daily stock market movements of 30 U.S. publicly-traded companies listed on the NASDAQ or the New York Stock Exchange (NYSE). The 30 publicly-owned companies are considered leaders in the United States economy. An investor cannot directly invest in an index. The volatility of the benchmark may be materially different from the individual performance obtained by a specific investor.
The Bloomberg Global Aggregate Index is a flagship measure of global investment grade debt from twenty-four local currency markets. This multi-currency benchmark includes treasury, government-related, corporate and securitized fixed-rate bonds from both developed and emerging markets issuers. An investor cannot invest directly in an index. The volatility of the benchmark may be materially different from the individual performance obtained by a specific investor.
The ICE Exchange-Listed Fixed & Adjustable Rate Preferred Securities Index is a modified market capitalization weighted index composed of preferred stock and securities that are functionally equivalent to preferred stock including, but not limited to, depositary preferred securities, perpetual subordinated debt and certain securities issued by banks and other financial institutions that are eligible for capital treatment with respect to such instruments akin to that received for issuance of straight preferred stock. An investor cannot invest directly in an index. The volatility of the benchmark may be materially different from the individual performance obtained by a specific investor.
The MSCI ACWI ex U.S. Index captures large and mid-cap representation across 22 of 23 Developed Markets (DM) countries (excluding the United States) and 24 Emerging Markets (EM) countries. The index covers approximately 85% of the global equity opportunity set outside the U.S. An investor cannot invest directly in an index. The volatility of the benchmark may be materially different from the individual performance obtained by a specific investor.
The Russell 2000 Index is a well-known, unmanaged index of the prices of 2000 small-cap company common stocks, selected by Russell. The Russell 2000 Index assumes reinvestment of dividends but does not reflect advisory fees. An investor cannot invest directly in an index. The volatility of the benchmark may be materially different from the individual performance obtained by a specific investor.
The S&P Mid Cap 400 provides investors with a benchmark for mid-sized companies. The index, which is distinct from the large-cap S&P 500, is designed to measure the performance of 400 mid-sized companies, reflecting the distinctive risk and return characteristics of this market segment.
The S&P 500 Pure Value index is a style-concentrated index designed to track the performance of stocks that exhibit the strongest value characteristics by using a style-attractiveness-weighting scheme. An investor cannot directly invest in an index. The volatility of the benchmark may be materially different from the individual performance obtained by a specific investor.
The CBOE Volatility Index (VIX) is a calculation designed to produce a measure of constant, 30-day expected volatility of the U.S. stock market, derived from real-time, mid-quote prices of S&P 500 Index call and put options. On a global basis, it is one of the most recognized measures of volatility -- widely reported by financial media and closely followed by a variety of market participants as a daily market indicator. The volatility of the benchmark may be materially different from the individual performance obtained by a specific investor. An investor cannot invest directly in an index.