U.S. and global equity markets have been in a sustained volatile patch since early summer, and a look at the S&P 500 over the last year demonstrates how the ups and downs have netted flat returns. Whether you want to blame the trade war, slowing corporate earnings growth, weakening China and European economic fundamentals, the inverted yield curve, or some combination of them all, stocks have been fighting an uphill battle.
The S&P 500 Over the Last Year
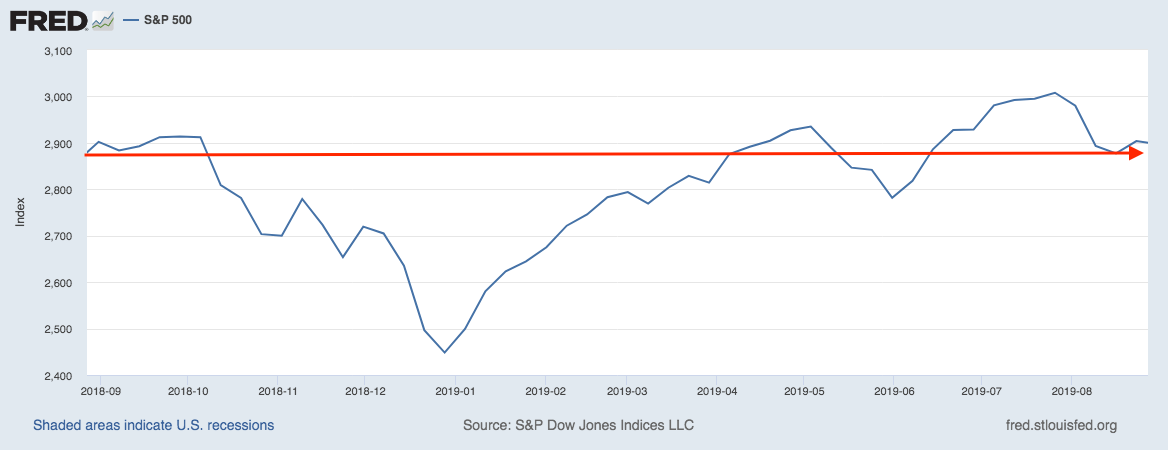
Source: Federal Reserve Bank of St. Louis1
As uncertainty grows over how much longer the global economic expansion can last, central banks and governments have been posturing to respond with fresh economic stimulus, rate cuts, or both. But at the same time, investors have been increasingly pouring into safer assets like U.S. Treasuries. As you can see in the chart below, the 30-year U.S. Treasury (red line) and the 10-year U.S. Treasury (blue line) have been in a sustained decline as demand for safety continues to rise.
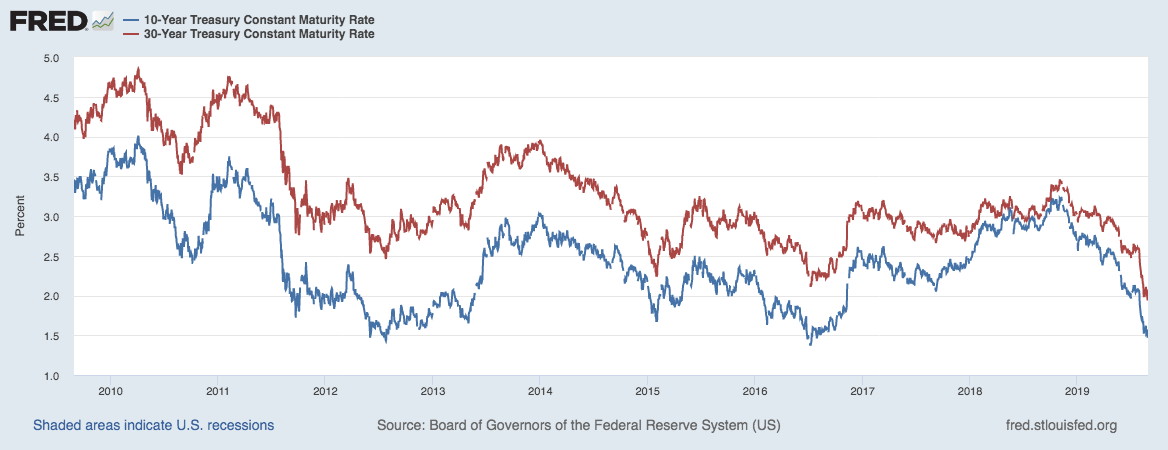
Source: Federal Reserve Bank of St. Louis2
Some investors may look at the broader picture and think, “Wouldn’t now be a good time to go to cash?” If the future is this uncertain and all the signs are pointing towards a recession and weak stock performance in the short-to-medium term, why not just shift to cash and wait until the economic outlook improves?
But my message to readers is that even in uncertain times, going to cash is not a good idea. I believe that as a general rule, a high allocation to cash over the long-term raises the risk that an investor will fall short of achieving their financial goals. The two exceptions to this rule, in my view, are (1) if a person has the cash earmarked for a short-term cash flow need, say in the next year or two; or, (2) if a person has sufficient wealth that they don’t need growth to meet their financial goals. Outside of these two exceptions, I think you should plan to stay invested.
To see why timing the markets and avoiding risk by going to cash can be harmful, just look at what happens if an investor misses big up days in the market. The hypothetical table below looks at the performance of $10,000 invested in the S&P 500 between January 4, 1988 and December 31, 2018. It’s important to note that this $10,000 was exposed to two of the biggest bear markets in stock market history, the 2000 tech bubble crash and the 2008 global financial crisis.
| Fully Invested | Missed 10 best days | Missed 20 best days | Missed 30 best days | Missed 40 best days | Missed 50 best days | Missed 60 best days | |
| Annualized Return | +10.05% | +7.61% | +5.96% | +4.54% | +3.24% | +2.03% | +0.91% |
| Total Cumulative Return | 1846.86% | 871.60% | 502.18% | 296.39% | 168.90% | 86.56% | 32.5% |
| Ending Value | $194,686 | $97,160 | $60,218 | $39,639 | $26,889 | $18,656 | $13,250 |
Even missing the 10 best days over that period meant leaving half of your potential total return on the table.
But here’s the real kicker: Six of the 10 “best days” in the market were within just weeks of the worst days in the market. In other words, some of the best days often happen as “v-shaped” bounces off the worst days. Going to cash on a big negative day means increasing the risk of missing a big positive day, which as you can see from the table above, can have a significant impact on total return over time.
Bottom Line for Investors
Uncertainty and volatility in the equity markets is likely to persist for the balance of the year and beyond. But an investor’s response should not be to run for cover and go to cash, in my view. I firmly believe that doing so reduces your chances of reaching your long-term goals. Instead, if the uncertainty and volatility has you nervous about what the short-to-medium term holds, I would recommend revisiting your asset allocation, where you can control your risk profile by investing in different categories of equities and fixed income – and tweaking your exposures to each.
Disclosure
2 Board of Governors of the Federal Reserve System (US), 10-Year Treasury Constant Maturity Rate [DGS10], retrieved from FRED, Federal Reserve Bank of St. Louis; https://fred.stlouisfed.org/series/DGS10, September 3, 2019.
DISCLOSURE
Past performance is no guarantee of future results. Inherent in any investment is the potential for loss.
Zacks Investment Management, Inc. is a wholly-owned subsidiary of Zacks Investment Research. Zacks Investment Management is an independent Registered Investment Advisory firm and acts as an investment manager for individuals and institutions. Zacks Investment Research is a provider of earnings data and other financial data to institutions and to individuals.
This material is being provided for informational purposes only and nothing herein constitutes investment, legal, accounting or tax advice, or a recommendation to buy, sell or hold a security. Do not act or rely upon the information and advice given in this publication without seeking the services of competent and professional legal, tax, or accounting counsel. Publication and distribution of this article is not intended to create, and the information contained herein does not constitute, an attorney-client relationship. No recommendation or advice is being given as to whether any investment or strategy is suitable for a particular investor. It should not be assumed that any investments in securities, companies, sectors or markets identified and described were or will be profitable. All information is current as of the date of herein and is subject to change without notice. Any views or opinions expressed may not reflect those of the firm as a whole.
Any projections, targets, or estimates in this report are forward looking statements and are based on the firm’s research, analysis, and assumptions. Due to rapidly changing market conditions and the complexity of investment decisions, supplemental information and other sources may be required to make informed investment decisions based on your individual investment objectives and suitability specifications. All expressions of opinions are subject to change without notice. Clients should seek financial advice regarding the appropriateness of investing in any security or investment strategy discussed in this presentation.
Certain economic and market information contained herein has been obtained from published sources prepared by other parties. Zacks Investment Management does not assume any responsibility for the accuracy or completeness of such information. Further, no third party has assumed responsibility for independently verifying the information contained herein and accordingly no such persons make any representations with respect to the accuracy, completeness or reasonableness of the information provided herein. Unless otherwise indicated, market analysis and conclusions are based upon opinions or assumptions that Zacks Investment Management considers to be reasonable. Any investment inherently involves a high degree of risk, beyond any specific risks discussed herein.
It is not possible to invest directly in an index. Investors pursuing a strategy similar to an index may experience higher or lower returns, which will be reduced by fees and expenses.
The S&P 500 Index is a well-known, unmanaged index of the prices of 500 large-company common stocks, mainly blue-chip stocks, selected by Standard & Poor’s. The S&P 500 Index assumes reinvestment of dividends but does not reflect advisory fees. The volatility of the benchmark may be materially different from the individual performance obtained by a specific investor. An investor cannot invest directly in an index.