Two months ago, the yield curve ‘inversion’ was one of the most cited data points for recession worries. And for good reason – sustained yield curve inversions have preceded nearly every recession in the post-World War II era. Considering that pockets of U.S. macroeconomic data were showing weakness around the same time as the inversion, the yield curve played perfectly into negative sentiment building around the current economic expansion.
That was summer. Today, the yield curve has turned positive again, after what ultimately amounted to a relatively brief inversion. In the charts below, a yield curve inverts when the blue line falls below zero, which you can see occurred in the summer and early fall months of this year. Today, the yield on the 10-year U.S. Treasury bond is higher than the 3-month and 2-year U.S. Treasury bonds (depending on your preferred measure for the yield curve), creating a slightly positive – but essentially flat – yield curve.
Yield Curve as Measured by 10-Year U.S. Treasury Minus 3-Month US Treasury
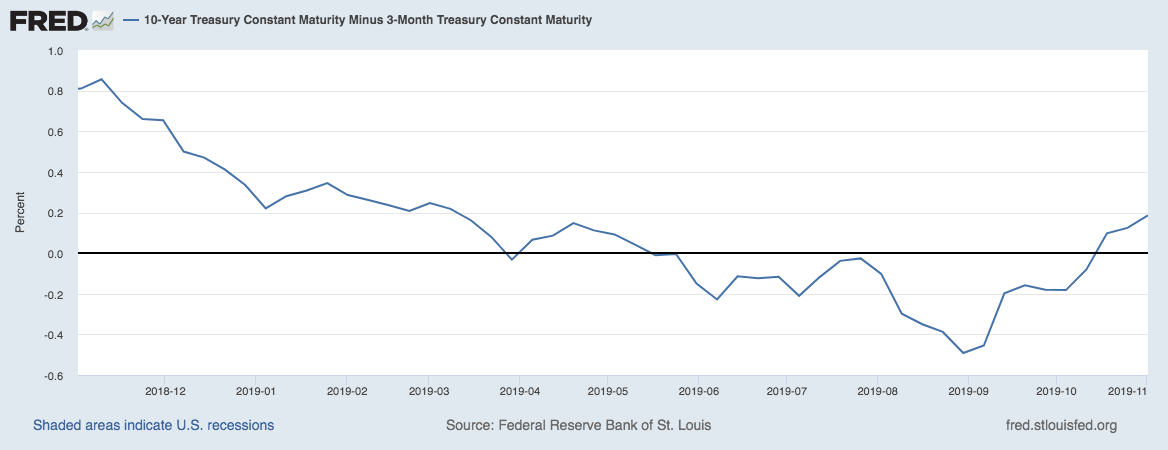
Source: Federal Reserve Bank of St. Louis1
Yield Curve as Measured by 10-Year US Treasury Minus 2-Year US Treasury
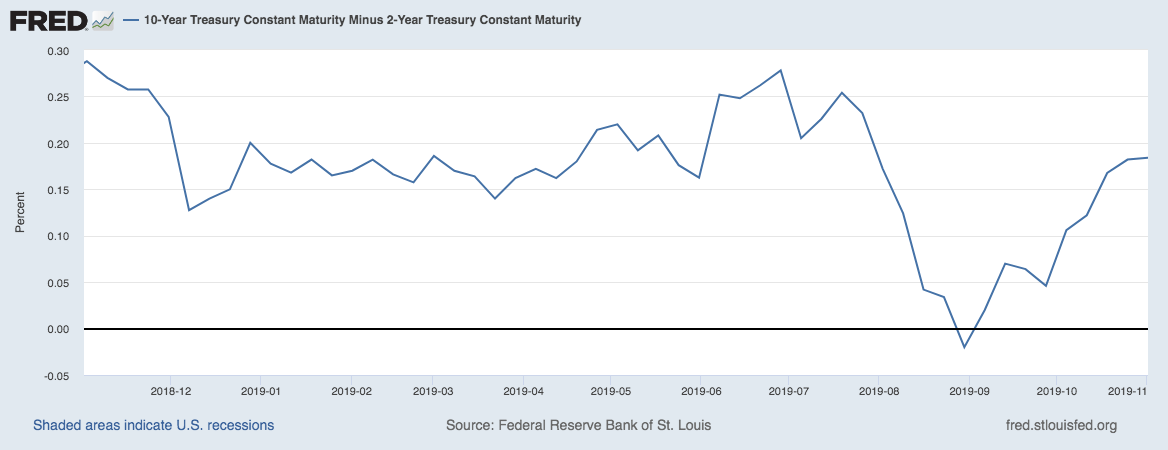
Source: Federal Reserve Bank of St. Louis2
Now that the yield curve has turned positive again, one would think that the recession narrative would ease up a bit, giving way to more positive readings on economic growth. But that hasn’t been the case – as far as I can tell, the ‘wall of worry’ has gotten even bigger. I would argue this is good news for stocks, for three reasons.
For one, it was not very well disseminated that while yield curve inversions almost always precede recessions, it does not necessarily happen right away. Recessions triggered by the inversion of the yield curve don’t, on average, materialize until 22 months after the event, and during that time, the S&P 500 has tended to rally. In the post-World War II era, on average, the S&P 500 has rallied more than 15% in the 18 months following a yield curve inversion.4
The second reason is that we have not seen anywhere near the deterioration in the labor (jobs) or credit markets that we have seen historically with yield curve inversions. Lending growth at banks remains positive and net interest margins are higher than what the yield curve implies. The rates banks are charging on mortgages, credit cards, and business loans are materially higher than the yields on the 10- and 30-year U.S. Treasury bond.3
Finally, it is important to take note when positive economic developments are largely ignored. When the yield curve inverted over the summer, it grabbed headlines and fueled recession chatter on a near-daily basis. But when the yield curve turned positive – which should have brought relief to the markets that a recession fear faded – it was largely tuned out by most pundits and the press. When pessimism rules the day, expectations are often lowered too far and recession risks get priced-in – giving way for underappreciated economic positives to ultimately drive stock prices higher, in my view.
Bottom Line for Investors
In my view, we’re in an environment where even the slightest bit of negative news adds to the “wall of worry,” but positive news is largely ignored. The yield curve in 2019 offers a perfect example of how this plays out: A yield curve inversion happens over the summer and signals forthcoming recession, followed by the yield curve turning back to the positive a few months later and receiving no air time.
The stock market is ultimately driven by expectations versus reality, in my view, and when expectations are low and falling – but the reality points to economic growth (even if middling) – I think the positive surprises along the way are what lead to higher prices.
Disclosure
2 Federal Reserve Bank of St. Louis, 10-Year Treasury Constant Maturity Minus 2-Year Treasury Constant Maturity [T10Y2Y], retrieved from FRED, Federal Reserve Bank of St. Louis; https://fred.stlouisfed.org/series/T10Y2Y, November 5, 2019.
3 Bloomberg, August 15, 2019. https://www.bloomberg.com/graphics/2019-yield-curve-inversions/
DISCLOSURE
Past performance is no guarantee of future results. Inherent in any investment is the potential for loss.
Zacks Investment Management, Inc. is a wholly-owned subsidiary of Zacks Investment Research. Zacks Investment Management is an independent Registered Investment Advisory firm and acts as an investment manager for individuals and institutions. Zacks Investment Research is a provider of earnings data and other financial data to institutions and to individuals.
This material is being provided for informational purposes only and nothing herein constitutes investment, legal, accounting or tax advice, or a recommendation to buy, sell or hold a security. Do not act or rely upon the information and advice given in this publication without seeking the services of competent and professional legal, tax, or accounting counsel. Publication and distribution of this article is not intended to create, and the information contained herein does not constitute, an attorney-client relationship. No recommendation or advice is being given as to whether any investment or strategy is suitable for a particular investor. It should not be assumed that any investments in securities, companies, sectors or markets identified and described were or will be profitable. All information is current as of the date of herein and is subject to change without notice. Any views or opinions expressed may not reflect those of the firm as a whole.
Any projections, targets, or estimates in this report are forward looking statements and are based on the firm’s research, analysis, and assumptions. Due to rapidly changing market conditions and the complexity of investment decisions, supplemental information and other sources may be required to make informed investment decisions based on your individual investment objectives and suitability specifications. All expressions of opinions are subject to change without notice. Clients should seek financial advice regarding the appropriateness of investing in any security or investment strategy discussed in this presentation.
Certain economic and market information contained herein has been obtained from published sources prepared by other parties. Zacks Investment Management does not assume any responsibility for the accuracy or completeness of such information. Further, no third party has assumed responsibility for independently verifying the information contained herein and accordingly no such persons make any representations with respect to the accuracy, completeness or reasonableness of the information provided herein. Unless otherwise indicated, market analysis and conclusions are based upon opinions or assumptions that Zacks Investment Management considers to be reasonable. Any investment inherently involves a high degree of risk, beyond any specific risks discussed herein.
It is not possible to invest directly in an index. Investors pursuing a strategy similar to an index may experience higher or lower returns, which will be reduced by fees and expenses.