Does It Matter How Many Times the Fed Cuts Rates in 2024?
In my column last week, I wrote that the end of ‘synchronized global monetary tightening’ could mean the dissipation of a key headwind for stocks. I deliberately did not frame the end of the tightening cycle as a tailwind—stocks’ performance depends on too many other factors, like earnings growth, expectations for economic growth in the year(s) ahead, investor sentiment, geopolitics, and so on.1
This brings me to the question I’m addressing this week: Does it matter how many times the Fed cuts rates in 2024, or if they even cut rates at all?
We know from December minutes that the Federal Reserve is projecting the benchmark fed funds rate will end 2024 in a range of 4.5% to 4.75%, which seems to imply three 25-basis-point cuts sometime this year. As of last week, the market (via futures contracts) is betting the Fed will deliver five 25 basis-point-cuts. This disconnect has many investors worried. What happens to stocks if the Fed underdelivers?
The answer often given is that fewer than expected rate cuts—or worse, no cuts at all—would end the bull market and result in an economic recession. Monetary policy works on a lag, so I think there’s some fairness to the recession argument. Keeping rates too high for too long could result in sustained funding pressure for banks, since deposit rates would need to move steadily higher. This hasn’t been a problem for banks yet—national average savings deposit rates are well below the effective Fed funds rate (0.46% vs. 5% to 5.25%), but eventually, banks will increasingly need to compete for deposits, driving those rates higher. Net interest margins shrink when deposit rates rise closer in line with long rates, which can choke off lending and by extension economic activity and investment. I’m not convinced this is a 2024 issue, however, given that banks (especially large ones) are flush with deposits.
So, what about the bull market?
My thinking goes back to a topic I wrote about last year when I tested the potency of the “Don’t fight the Fed” mantra. Over the past few years, I’ve seen financial media focus more and more on the role the Fed plays in determining stock market returns, and I continue to believe the correlation is not only misguided, but also misleading.
History tells the story. To start, two of the last three rate-cut cycles (2000-2003, 2007-2008) coincided with falling stocks. A third rate cut cycle, which started in 2019 and unexpectedly went into overdrive in 2020 with the pandemic, did not. Looking back even further, Fed cuts in the mid-1980s corresponded with positive stock returns, but the rate cuts from mid-1989 to 1992 aligned with a volatile period that included a bear market.
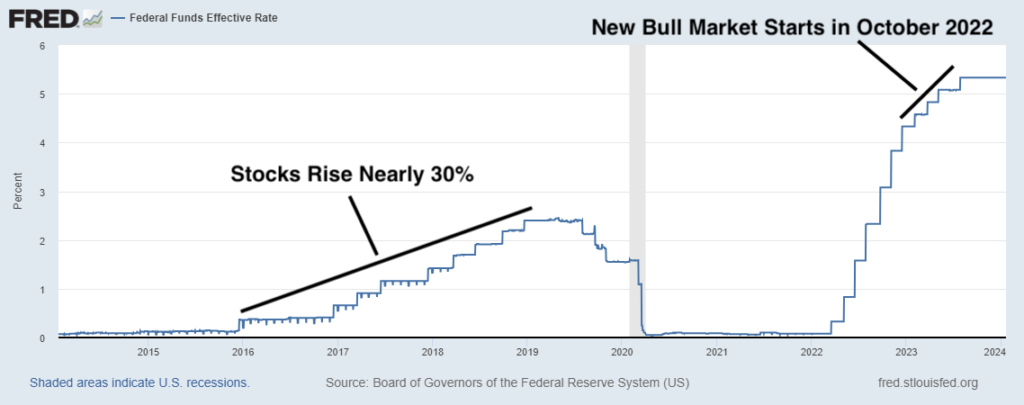
On the flip side, recent history proves that stocks can do well even as the Federal Reserve is engaged in monetary policy tightening. As seen in the chart below, the Fed was raising rates steadily from 2016 to 2019, and stocks went up almost 30% over that period. Then, in October 2022, a new bull market began even as the Fed was aggressively raising rates and telegraphing its “higher-for-longer” stance on monetary policy.
Effective Federal Funds Rate, 2014 – Present
In short, there just isn’t enough historical evidence—via the correlation between rate hikes/cuts and stock market performance—to say that it’s all riding on the Fed in 2024. Too many other factors matter, too.
Bottom Line for Investors
As I’ve written a few times recently, I’m not arguing that monetary policy decisions are meaningless to stock market performance. Interest rate hikes and/or cuts are key factors determining financial conditions and the outlook for earnings and growth, which in turn makes them a critical factor driving stock prices.
The point I’ve been making recently, however, is that monetary policy isn’t the only factor driving stock returns, and the Fed doesn’t have make-or-break power over the stock market. At the end of the day, a strong fundamental economy and rising earnings matter far more than two, three, five, or zero rate cuts in the new year. History tells us as much.
Disclosure
2 Fred Economic Data. January 22, 2023. https://fred.stlouisfed.org/series/DFF#’’
DISCLOSURE
Past performance is no guarantee of future results. Inherent in any investment is the potential for loss.
Zacks Investment Management, Inc. is a wholly-owned subsidiary of Zacks Investment Research. Zacks Investment Management is an independent Registered Investment Advisory firm and acts as an investment manager for individuals and institutions. Zacks Investment Research is a provider of earnings data and other financial data to institutions and to individuals.
This material is being provided for informational purposes only and nothing herein constitutes investment, legal, accounting or tax advice, or a recommendation to buy, sell or hold a security. Do not act or rely upon the information and advice given in this publication without seeking the services of competent and professional legal, tax, or accounting counsel. Publication and distribution of this article is not intended to create, and the information contained herein does not constitute, an attorney-client relationship. No recommendation or advice is being given as to whether any investment or strategy is suitable for a particular investor. It should not be assumed that any investments in securities, companies, sectors or markets identified and described were or will be profitable. All information is current as of the date of herein and is subject to change without notice. Any views or opinions expressed may not reflect those of the firm as a whole.
Any projections, targets, or estimates in this report are forward looking statements and are based on the firm’s research, analysis, and assumptions. Due to rapidly changing market conditions and the complexity of investment decisions, supplemental information and other sources may be required to make informed investment decisions based on your individual investment objectives and suitability specifications. All expressions of opinions are subject to change without notice. Clients should seek financial advice regarding the appropriateness of investing in any security or investment strategy discussed in this presentation.
Certain economic and market information contained herein has been obtained from published sources prepared by other parties. Zacks Investment Management does not assume any responsibility for the accuracy or completeness of such information. Further, no third party has assumed responsibility for independently verifying the information contained herein and accordingly no such persons make any representations with respect to the accuracy, completeness or reasonableness of the information provided herein. Unless otherwise indicated, market analysis and conclusions are based upon opinions or assumptions that Zacks Investment Management considers to be reasonable. Any investment inherently involves a high degree of risk, beyond any specific risks discussed herein.
The S&P 500 Index is a well-known, unmanaged index of the prices of 500 large-company common stocks, mainly blue-chip stocks, selected by Standard & Poor’s. The S&P 500 Index assumes reinvestment of dividends but does not reflect advisory fees. The volatility of the benchmark may be materially different from the individual performance obtained by a specific investor. An investor cannot invest directly in an index.
The Russell 1000 Growth Index is a well-known, unmanaged index of the prices of 1000 large-company growth common stocks selected by Russell. The Russell 1000 Growth Index assumes reinvestment of dividends but does not reflect advisory fees. An investor cannot invest directly in an index. The volatility of the benchmark may be materially different from the individual performance obtained by a specific investor.
Nasdaq Composite Index is the market capitalization-weighted index of over 3,300 common equities listed on the Nasdaq stock exchange. The types of securities in the index include American depositary receipts, common stocks, real estate investment trusts (REITs) and tracking stocks, as well as limited partnership interests. The index includes all Nasdaq-listed stocks that are not derivatives, preferred shares, funds, exchange-traded funds (ETFs) or debenture securities. An investor cannot invest directly in an index. The volatility of the benchmark may be materially different from the individual performance obtained by a specific investor.
The Dow Jones Industrial Average measures the daily stock market movements of 30 U.S. publicly-traded companies listed on the NASDAQ or the New York Stock Exchange (NYSE). The 30 publicly-owned companies are considered leaders in the United States economy. An investor cannot directly invest in an index. The volatility of the benchmark may be materially different from the individual performance obtained by a specific investor.
The Bloomberg Global Aggregate Index is a flagship measure of global investment grade debt from twenty-four local currency markets. This multi-currency benchmark includes treasury, government-related, corporate and securitized fixed-rate bonds from both developed and emerging markets issuers. An investor cannot invest directly in an index. The volatility of the benchmark may be materially different from the individual performance obtained by a specific investor.
The ICE Exchange-Listed Fixed & Adjustable Rate Preferred Securities Index is a modified market capitalization weighted index composed of preferred stock and securities that are functionally equivalent to preferred stock including, but not limited to, depositary preferred securities, perpetual subordinated debt and certain securities issued by banks and other financial institutions that are eligible for capital treatment with respect to such instruments akin to that received for issuance of straight preferred stock. An investor cannot invest directly in an index. The volatility of the benchmark may be materially different from the individual performance obtained by a specific investor.
The MSCI ACWI ex U.S. Index captures large and mid-cap representation across 22 of 23 Developed Markets (DM) countries (excluding the United States) and 24 Emerging Markets (EM) countries. The index covers approximately 85% of the global equity opportunity set outside the U.S. An investor cannot invest directly in an index. The volatility of the benchmark may be materially different from the individual performance obtained by a specific investor.
The Russell 2000 Index is a well-known, unmanaged index of the prices of 2000 small-cap company common stocks, selected by Russell. The Russell 2000 Index assumes reinvestment of dividends but does not reflect advisory fees. An investor cannot invest directly in an index. The volatility of the benchmark may be materially different from the individual performance obtained by a specific investor.
The S&P Mid Cap 400 provides investors with a benchmark for mid-sized companies. The index, which is distinct from the large-cap S&P 500, is designed to measure the performance of 400 mid-sized companies, reflecting the distinctive risk and return characteristics of this market segment.
The S&P 500 Pure Value index is a style-concentrated index designed to track the performance of stocks that exhibit the strongest value characteristics by using a style-attractiveness-weighting scheme. An investor cannot directly invest in an index. The volatility of the benchmark may be materially different from the individual performance obtained by a specific investor.