Why You Shouldn’t Worry About January Inflation Data
On February 13th, the U.S. Bureau of Labor Statistics reported that the consumer price index (CPI) measure of inflation rose 0.3% month-over-month in January, and 3.1% year-over-year. This inflation print was materially higher than consensus estimates for a 2.9% increase.
The news sent equity markets into a volatile session. The S&P closed down more than -1%, and the Russell 2000 index of small-cap stocks—which tends to be growth and interest rate sensitive—sank by approximately -4%. Meanwhile, yields on 10-year U.S. Treasuries jumped.1
In short, it was not the news investors wanted to hear. But I wasn’t worried.
For one, I am not convinced that the bull market is driven solely by expectations for rate cuts, as many pundits suggest. U.S. stocks started rallying in October 2022, which was a time when the Fed was still raising rates aggressively and no one was forecasting cuts. But I’ve also argued that stocks were rallying ahead of better-than-expected economic growth in 2023, and also in anticipation of an earnings rebound I think started in Q3 2023. January’s inflation data, and shifting expectations for rate cuts in 2024, did not change those fundamentals.
The second reason not to worry about January CPI was the outsized role played by “shelter costs.” Shelter costs refer to the cost of housing. Its relative importance in CPI inflation data is huge – making up some 36% of the entire calculation. One subcategory of shelter costs, called owner’s equivalent rent (OER), is responsible for about 25% of CPI.
In the January data, shelter costs increased by +0.6% month-over-month, which marked an acceleration from December’s +0.4% month-over-month increase. Because of its relative importance, this single data point can pull CPI significantly higher for the month.
The question, though, is whether the shelter cost calculation – and in particular OER – is truly reflective of residential housing costs across the country today. I would argue it isn’t.
In order to calculate OER, the Bureau of Labor Statistics’ Consumer Expenditure Survey asks participating Americans the following question: “If someone were to rent your home today, how much do you think it would rent for monthly, unfurnished and without utilities?” While I understand some homeowners do rent their houses out for extra cash, it is also fair to label this question – and the data it produces – as purely hypothetical. It’s a made-up number, but it also has a disproportionately large impact on the CPI calculation.
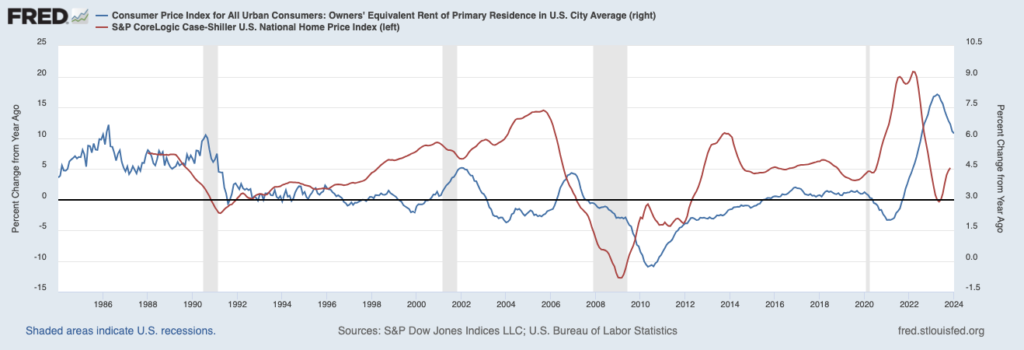
In my view, the calculation is problematic. Asking homeowners how much they would rent their house for is a strange way to determine housing costs. But we also know from analyzing the data that OER lags actual housing prices by over a year. Even as housing prices began to decline year-over-year in April 2022 (red line in the chart below), OER continued to move higher for about 15 months (blue line in the chart below). If this relationship holds—which I firmly believe it will—we can expect shelter costs to fall by about half over the next nine months, which should have an anchoring effect on the CPI calculation.
Shelter Costs (OER) Lag Housing Prices by Over a Year
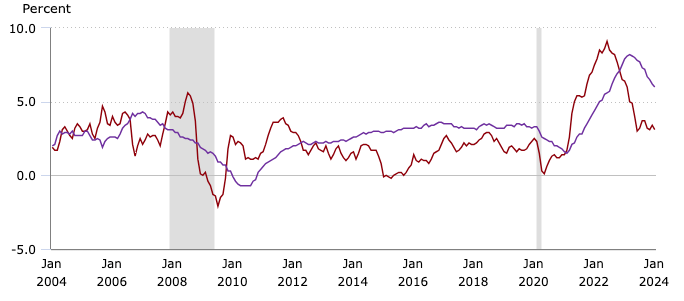
The chart below shows the clear effect that high shelter costs are having on the CPI figure. The purple line shows shelter costs while the red line shows headline CPI. Again, with shelter costs making up some 36% of the CPI calculation, it’s clear that elevated readings—which we’ve established are lagging and not necessarily reflective of housing prices across the country—are pulling the CPI number higher. If it weren’t for shelter costs, CPI (ex-shelter) in January would have been 1.6% year-over-year.
CPI (All Items, Red Line) vs. Shelter Costs (Purple Line)
Knowing what we know about housing prices and the OER calculation, we can reasonably predict that January’s 6.2% OER print will fall to under 3% by this fall. With other elements of the inflation data still trending in the right direction—goods inflation, for example, continues to be negative—I think worries about Fed cuts and price pressures will all but fade completely within a few months.
Bottom Line for Investors
As I stated early in this week’s column, the overall outlook for the U.S. economy—whether you look at jobs, consumer spending, corporate earnings, services activity, wages, etc.—continues to be fundamentally positive, even with one month’s higher-than-expected inflation print. Even still, the CPI number may not matter as much as investors think it does. The Federal Reserve’s preferred inflation gauge, the headline personal consumption expenditures (PCE) price index, puts a smaller weight on housing costs than CPI.
Disclosure
2 Fred Economic Data. February 13, 2024. https://fred.stlouisfed.org/series/CUSR0000SEHC01#
3 U.S. Bureau of Labor Statistics. 2024. https://www.bls.gov/charts/consumer-price-index/consumer-price-index-by-category-line-chart.htm
DISCLOSURE
Past performance is no guarantee of future results. Inherent in any investment is the potential for loss.
Zacks Investment Management, Inc. is a wholly-owned subsidiary of Zacks Investment Research. Zacks Investment Management is an independent Registered Investment Advisory firm and acts as an investment manager for individuals and institutions. Zacks Investment Research is a provider of earnings data and other financial data to institutions and to individuals.
This material is being provided for informational purposes only and nothing herein constitutes investment, legal, accounting or tax advice, or a recommendation to buy, sell or hold a security. Do not act or rely upon the information and advice given in this publication without seeking the services of competent and professional legal, tax, or accounting counsel. Publication and distribution of this article is not intended to create, and the information contained herein does not constitute, an attorney-client relationship. No recommendation or advice is being given as to whether any investment or strategy is suitable for a particular investor. It should not be assumed that any investments in securities, companies, sectors or markets identified and described were or will be profitable. All information is current as of the date of herein and is subject to change without notice. Any views or opinions expressed may not reflect those of the firm as a whole.
Any projections, targets, or estimates in this report are forward looking statements and are based on the firm’s research, analysis, and assumptions. Due to rapidly changing market conditions and the complexity of investment decisions, supplemental information and other sources may be required to make informed investment decisions based on your individual investment objectives and suitability specifications. All expressions of opinions are subject to change without notice. Clients should seek financial advice regarding the appropriateness of investing in any security or investment strategy discussed in this presentation.
Certain economic and market information contained herein has been obtained from published sources prepared by other parties. Zacks Investment Management does not assume any responsibility for the accuracy or completeness of such information. Further, no third party has assumed responsibility for independently verifying the information contained herein and accordingly no such persons make any representations with respect to the accuracy, completeness or reasonableness of the information provided herein. Unless otherwise indicated, market analysis and conclusions are based upon opinions or assumptions that Zacks Investment Management considers to be reasonable. Any investment inherently involves a high degree of risk, beyond any specific risks discussed herein.
The S&P 500 Index is a well-known, unmanaged index of the prices of 500 large-company common stocks, mainly blue-chip stocks, selected by Standard & Poor’s. The S&P 500 Index assumes reinvestment of dividends but does not reflect advisory fees. The volatility of the benchmark may be materially different from the individual performance obtained by a specific investor. An investor cannot invest directly in an index.
The Russell 1000 Growth Index is a well-known, unmanaged index of the prices of 1000 large-company growth common stocks selected by Russell. The Russell 1000 Growth Index assumes reinvestment of dividends but does not reflect advisory fees. An investor cannot invest directly in an index. The volatility of the benchmark may be materially different from the individual performance obtained by a specific investor.
Nasdaq Composite Index is the market capitalization-weighted index of over 3,300 common equities listed on the Nasdaq stock exchange. The types of securities in the index include American depositary receipts, common stocks, real estate investment trusts (REITs) and tracking stocks, as well as limited partnership interests. The index includes all Nasdaq-listed stocks that are not derivatives, preferred shares, funds, exchange-traded funds (ETFs) or debenture securities. An investor cannot invest directly in an index. The volatility of the benchmark may be materially different from the individual performance obtained by a specific investor.
The Dow Jones Industrial Average measures the daily stock market movements of 30 U.S. publicly-traded companies listed on the NASDAQ or the New York Stock Exchange (NYSE). The 30 publicly-owned companies are considered leaders in the United States economy. An investor cannot directly invest in an index. The volatility of the benchmark may be materially different from the individual performance obtained by a specific investor.
The Bloomberg Global Aggregate Index is a flagship measure of global investment grade debt from twenty-four local currency markets. This multi-currency benchmark includes treasury, government-related, corporate and securitized fixed-rate bonds from both developed and emerging markets issuers. An investor cannot invest directly in an index. The volatility of the benchmark may be materially different from the individual performance obtained by a specific investor.
The ICE Exchange-Listed Fixed & Adjustable Rate Preferred Securities Index is a modified market capitalization weighted index composed of preferred stock and securities that are functionally equivalent to preferred stock including, but not limited to, depositary preferred securities, perpetual subordinated debt and certain securities issued by banks and other financial institutions that are eligible for capital treatment with respect to such instruments akin to that received for issuance of straight preferred stock. An investor cannot invest directly in an index. The volatility of the benchmark may be materially different from the individual performance obtained by a specific investor.
The MSCI ACWI ex U.S. Index captures large and mid-cap representation across 22 of 23 Developed Markets (DM) countries (excluding the United States) and 24 Emerging Markets (EM) countries. The index covers approximately 85% of the global equity opportunity set outside the U.S. An investor cannot invest directly in an index. The volatility of the benchmark may be materially different from the individual performance obtained by a specific investor.
The Russell 2000 Index is a well-known, unmanaged index of the prices of 2000 small-cap company common stocks, selected by Russell. The Russell 2000 Index assumes reinvestment of dividends but does not reflect advisory fees. An investor cannot invest directly in an index. The volatility of the benchmark may be materially different from the individual performance obtained by a specific investor.
The S&P Mid Cap 400 provides investors with a benchmark for mid-sized companies. The index, which is distinct from the large-cap S&P 500, is designed to measure the performance of 400 mid-sized companies, reflecting the distinctive risk and return characteristics of this market segment.
The S&P 500 Pure Value index is a style-concentrated index designed to track the performance of stocks that exhibit the strongest value characteristics by using a style-attractiveness-weighting scheme. An investor cannot directly invest in an index. The volatility of the benchmark may be materially different from the individual performance obtained by a specific investor.