Has the U.S. Dollar Been Too Strong for Too Long?
The U.S. dollar has spent nearly a decade in a strengthening trend. After the 2008 Global Financial Crisis, the U.S.’s relative economic and fundamental strengths helped the greenback appreciate against foreign currencies. Then, in response to soaring inflation, the Federal Reserve’s hawkish monetary tightening campaign in 2022 ushered-in even more currency appreciation (see chart below).1
Market participants were anticipating interest rate cuts in late 2023 and throughout 2024, which was supposed to trigger a significant dollar selloff. It hasn’t happened. Instead, inflation remains ‘sticky,’ the Fed has dashed hopes for rate cuts this year, and the dollar has strengthened even further.
U.S. Dollar Relative to Foreign Developed Economies’ Currencies
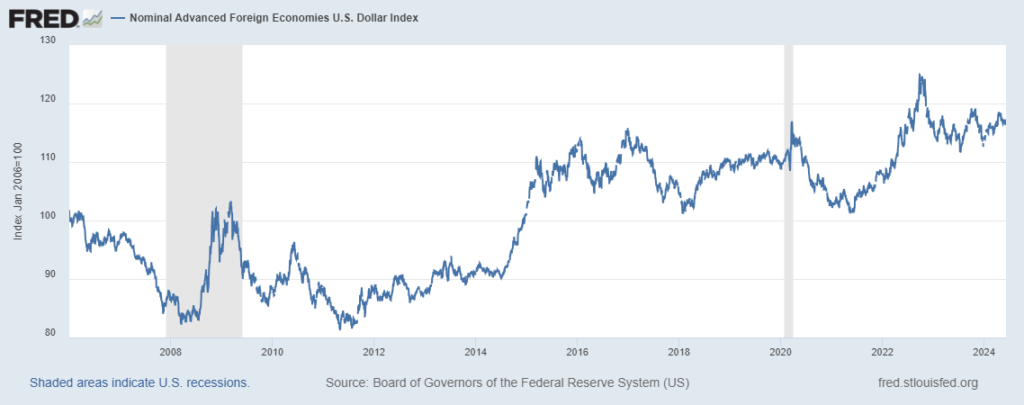
For context, the dollar is still below its 2022 peak, but it is also just 10% below levels in 1971—when then-President Nixon ended gold convertibility. We also haven’t seen a multi-year stretch of dollar strength like this since the 1980s, when the Volcker Fed had pushed rates into double-digit territory to quash inflation.
When it comes to the relative strength or weakness of the dollar, investors will hear arguments from both sides about the ‘dangers’ of too much strength or too much weakness. A weak dollar raises the cost of imports, reducing the purchasing power of U.S. consumers. A strong dollar threatens Emerging Markets currencies (especially those with large amounts of dollar-denominated debt) and multinationals’ profitability.
But in the current strong dollar environment, we’re not seeing many signs of stress either on multinationals’ earnings results or in the currency markets of foreign developing economies. And if markets are absorbing the impact of a stronger dollar now, I doubt we will see many issues when rates do come down in the U.S.
At the end of the day, what should concern investors is how a strong dollar impacts equity markets. The answer, fortunately, is that there are too many other factors—like earnings and economic growth—driving the equity markets for the dollar to have outsized influence.
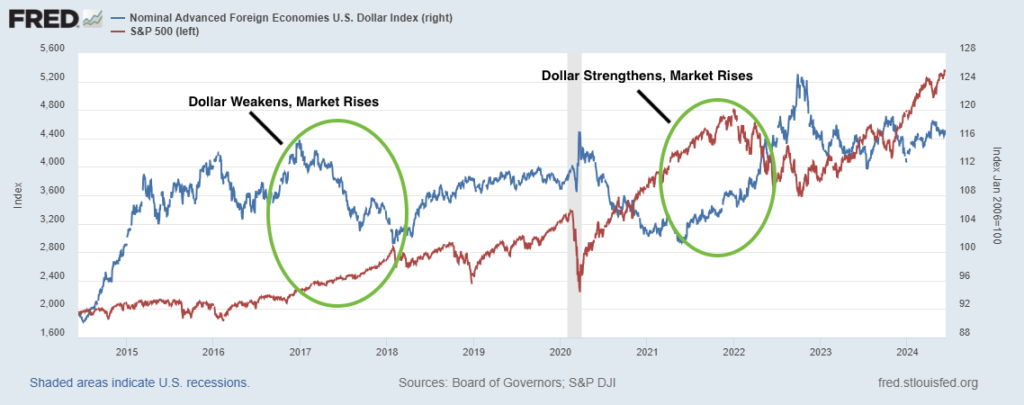
The chart below looks at the U.S. dollar relative to foreign currencies (blue line) and performance of the S&P 500 (red line) over the last 10 years. As investors can see, stocks have performed very well during periods when the dollar was weakening (left circle in the chart), and stocks have also rallied when the dollar strengthened substantially (right circle in the chart). The fact that there is no significant correlation historically between dollar strength or weakness and market returns tells us we should be focused on other fundamentals when making investment decisions.
The U.S. Dollar vs. Foreign Currencies (blue line, left axis) and S&P 500 (red line, right axis)
Bottom Line for Investors
The U.S. dollar has been strong relative to foreign currencies for years now, and 2024 has seen continued strengthening. While that trend has some market participants worried, the reality is that stronger or weaker dollars create both winners and losers, which makes neither inherently positive or negative.
Among the winners during strong dollar regimes are U.S. consumers, and also businesses that rely heavily on imports in order to drive domestic sales. Americans can stretch the value of the dollar when traveling overseas and/or buying goods and services from abroad, and businesses that rely on imports may see some input cost relief given that the dollar goes further.
To the extent that a strong dollar affects earnings, individual stocks can feel an impact. But broadly speaking, the stock market has done very well when the dollar was strengthening and weakening, and vice versa. There is no significant correlation between the two. A strengthening dollar historically corresponded with one of the best periods for stocks, 1995 – 2000, but also one of the worst: the 2008 bear market. At the same time, the dollar’s weakening period from 2003 – 2006 did not adversely impact the economic expansion and stock market recovery then, just like a strong dollar is not likely to shift the economy or market’s direction now.
In addition to the dollar, many investors are wondering how the upcoming election will impact the market’s direction. Perhaps more than usual, this election is generating strong opinions coming from every part of the political spectrum, and emotions are running high.
Disclosure
2 Board of Governors of the Federal Reserve System (US), Nominal Advanced Foreign Economies U.S. Dollar Index [DTWEXAFEGS], retrieved from FRED, Federal Reserve Bank of St. Louis; https://fred.stlouisfed.org/series/DTWEXAFEGS, June 12, 2024
3 Board of Governors of the Federal Reserve System (US), Nominal Advanced Foreign Economies U.S. Dollar Index [DTWEXAFEGS], retrieved from FRED, Federal Reserve Bank of St. Louis; https://fred.stlouisfed.org/series/DTWEXAFEGS, June 12, 2024.
DISCLOSURE
Past performance is no guarantee of future results. Inherent in any investment is the potential for loss.
Zacks Investment Management, Inc. is a wholly-owned subsidiary of Zacks Investment Research. Zacks Investment Management is an independent Registered Investment Advisory firm and acts as an investment manager for individuals and institutions. Zacks Investment Research is a provider of earnings data and other financial data to institutions and to individuals.
This material is being provided for informational purposes only and nothing herein constitutes investment, legal, accounting or tax advice, or a recommendation to buy, sell or hold a security. Do not act or rely upon the information and advice given in this publication without seeking the services of competent and professional legal, tax, or accounting counsel. Publication and distribution of this article is not intended to create, and the information contained herein does not constitute, an attorney-client relationship. No recommendation or advice is being given as to whether any investment or strategy is suitable for a particular investor. It should not be assumed that any investments in securities, companies, sectors or markets identified and described were or will be profitable. All information is current as of the date of herein and is subject to change without notice. Any views or opinions expressed may not reflect those of the firm as a whole.
Any projections, targets, or estimates in this report are forward looking statements and are based on the firm’s research, analysis, and assumptions. Due to rapidly changing market conditions and the complexity of investment decisions, supplemental information and other sources may be required to make informed investment decisions based on your individual investment objectives and suitability specifications. All expressions of opinions are subject to change without notice. Clients should seek financial advice regarding the appropriateness of investing in any security or investment strategy discussed in this presentation.
Certain economic and market information contained herein has been obtained from published sources prepared by other parties. Zacks Investment Management does not assume any responsibility for the accuracy or completeness of such information. Further, no third party has assumed responsibility for independently verifying the information contained herein and accordingly no such persons make any representations with respect to the accuracy, completeness or reasonableness of the information provided herein. Unless otherwise indicated, market analysis and conclusions are based upon opinions or assumptions that Zacks Investment Management considers to be reasonable. Any investment inherently involves a high degree of risk, beyond any specific risks discussed herein.
The S&P 500 Index is a well-known, unmanaged index of the prices of 500 large-company common stocks, mainly blue-chip stocks, selected by Standard & Poor’s. The S&P 500 Index assumes reinvestment of dividends but does not reflect advisory fees. The volatility of the benchmark may be materially different from the individual performance obtained by a specific investor. An investor cannot invest directly in an index.
The Russell 1000 Growth Index is a well-known, unmanaged index of the prices of 1000 large-company growth common stocks selected by Russell. The Russell 1000 Growth Index assumes reinvestment of dividends but does not reflect advisory fees. An investor cannot invest directly in an index. The volatility of the benchmark may be materially different from the individual performance obtained by a specific investor.
Nasdaq Composite Index is the market capitalization-weighted index of over 3,300 common equities listed on the Nasdaq stock exchange. The types of securities in the index include American depositary receipts, common stocks, real estate investment trusts (REITs) and tracking stocks, as well as limited partnership interests. The index includes all Nasdaq-listed stocks that are not derivatives, preferred shares, funds, exchange-traded funds (ETFs) or debenture securities. An investor cannot invest directly in an index. The volatility of the benchmark may be materially different from the individual performance obtained by a specific investor.
The Dow Jones Industrial Average measures the daily stock market movements of 30 U.S. publicly-traded companies listed on the NASDAQ or the New York Stock Exchange (NYSE). The 30 publicly-owned companies are considered leaders in the United States economy. An investor cannot directly invest in an index. The volatility of the benchmark may be materially different from the individual performance obtained by a specific investor.
The Bloomberg Global Aggregate Index is a flagship measure of global investment grade debt from twenty-four local currency markets. This multi-currency benchmark includes treasury, government-related, corporate and securitized fixed-rate bonds from both developed and emerging markets issuers. An investor cannot invest directly in an index. The volatility of the benchmark may be materially different from the individual performance obtained by a specific investor.
The ICE Exchange-Listed Fixed & Adjustable Rate Preferred Securities Index is a modified market capitalization weighted index composed of preferred stock and securities that are functionally equivalent to preferred stock including, but not limited to, depositary preferred securities, perpetual subordinated debt and certain securities issued by banks and other financial institutions that are eligible for capital treatment with respect to such instruments akin to that received for issuance of straight preferred stock. An investor cannot invest directly in an index. The volatility of the benchmark may be materially different from the individual performance obtained by a specific investor.
The MSCI ACWI ex U.S. Index captures large and mid-cap representation across 22 of 23 Developed Markets (DM) countries (excluding the United States) and 24 Emerging Markets (EM) countries. The index covers approximately 85% of the global equity opportunity set outside the U.S. An investor cannot invest directly in an index. The volatility of the benchmark may be materially different from the individual performance obtained by a specific investor.
The Russell 2000 Index is a well-known, unmanaged index of the prices of 2000 small-cap company common stocks, selected by Russell. The Russell 2000 Index assumes reinvestment of dividends but does not reflect advisory fees. An investor cannot invest directly in an index. The volatility of the benchmark may be materially different from the individual performance obtained by a specific investor.
The S&P Mid Cap 400 provides investors with a benchmark for mid-sized companies. The index, which is distinct from the large-cap S&P 500, is designed to measure the performance of 400 mid-sized companies, reflecting the distinctive risk and return characteristics of this market segment.
The S&P 500 Pure Value index is a style-concentrated index designed to track the performance of stocks that exhibit the strongest value characteristics by using a style-attractiveness-weighting scheme. An investor cannot directly invest in an index. The volatility of the benchmark may be materially different from the individual performance obtained by a specific investor.
The CBOE Volatility Index (VIX) is a calculation designed to produce a measure of constant, 30-day expected volatility of the U.S. stock market, derived from real-time, mid-quote prices of S&P 500 Index call and put options. On a global basis, it is one of the most recognized measures of volatility -- widely reported by financial media and closely followed by a variety of market participants as a daily market indicator. The volatility of the benchmark may be materially different from the individual performance obtained by a specific investor. An investor cannot invest directly in an index.