The Leading Economic Index (LEI) Keeps Flashing Warning Signals
In June, The Conference Board’s Leading Economic Index (LEI) fell -0.3% month-over-month, marking the sharpest drop since February and adding to over two years of successive declines. Readers can see in the chart below that LEI has been in a near-freefall since early 2022.1
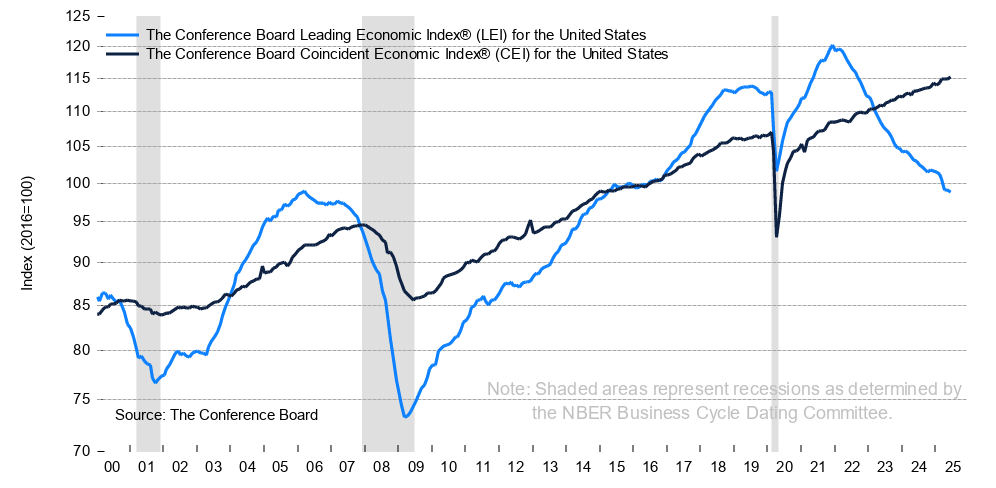
Historically speaking, these consecutive LEI declines would be a troubling sign for the U.S. economy. The index is designed to be a predictive tool, built on 10 components ranging from unemployment claims to building permits to stock prices. As seen above, the past three recessions have all been preceded by a LEI that tops out and rolls over.
Yet here we are, two years removed from LEI’s peak and subsequent declines, with no recession on the books or in sight.
Does this mean LEI is no longer a reliable indicator for the U.S. economy, meaning we should ignore it altogether when making macroeconomic forecasts? Not necessarily, in my view. There’s some context that matters here.
The first big piece is taking into account pandemic distortions. As readers may recall, lockdowns and massive fiscal stimulus (in the form of direct transfers) pulled forward demand for physical goods, which created an unnatural spike in the manufacturing sector. Among the components of the LEI are average weekly hours in manufacturing, new orders, and building permits, which are all geared toward manufacturing and goods-producing sectors.
The issue here is that the manufacturing hangover (post-pandemic) has been a major drag on LEI, even though the sector accounts for less than 20% of U.S. GDP. The U.S. is a services-based economy, and there is not much services-based economic data that goes into the LEI calculation.
The skew here matters. In recent readings, much of the weakness in the LEI comes from falling new orders in manufacturing, declining average work hours, and a slight uptick in jobless claims. Meanwhile, the U.S. services economy, including consumer spending, healthcare, technology, and financial services, continues to hold up solidly. This helps explain why LEI has been in decline since mid-2022, even as U.S. GDP has continued to grow.
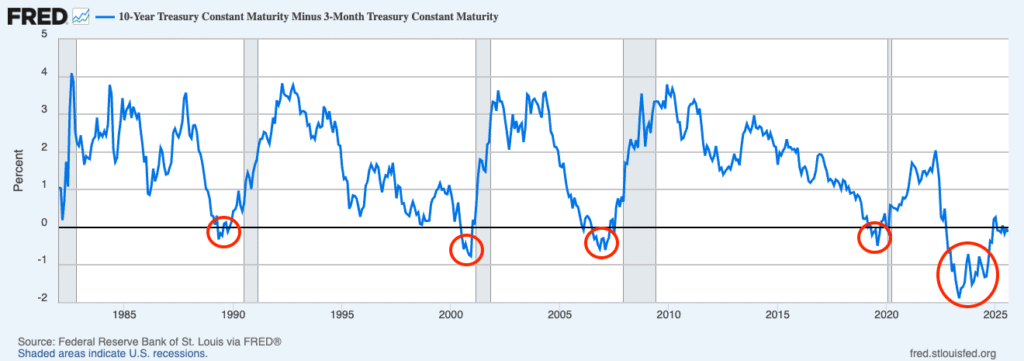
Another factor is the yield curve. LEI includes the interest rate spread between 10-year and fed funds rates, which has been inverted for much of the last two years (see chart below). Historically, an inverted yield curve has been a reliable recession signal, as relatively high borrowing rates can give way to a credit crunch. But banks today are still sitting on excess deposits from the pandemic era, muting the need to borrow at high short-term rates. Lending has slowed, but we’re not seeing a collapse.
I still think the LEI is a useful indicator for investors to track, even though its ability to predict recession has not panned out in this cycle. It’s an index that’s constantly evolving; the Conference Board revamped it in 2012 and removed outdated inputs like the M2 money supply and the University of Michigan sentiment index. Even earlier, in 1996, materials prices and manufacturers’ unfilled orders were replaced with the yield curve, reflecting changes in how we’ve come to understand economic inflection points.
Bottom Line for Investors
The trend in the LEI is worth watching going forward, but I don’t think we’re in a place where ‘it’s just a matter of time’ before the recession arrives. Much of the LEI’s current weakness reflects narrow slices of the economy that are not effectively capturing the full picture. Services remain strong, consumers are still spending, and corporate profits are holding up. These drivers represent the lion’s share of output. The key for market watchers is to treat LEI like one data point of many that you use to make forecasts and ‘check the pulse’ of the U.S. economy. No one indicator is sacrosanct or all-predicting.
Disclosure
2 Conference Board. 2025. https://www.conference-board.org/topics/us-leading-indicators/
3 Fred Economic Data. August 5, 2025. https://fred.stlouisfed.org/series/T10Y3M#
DISCLOSURE
Past performance is no guarantee of future results. Inherent in any investment is the potential for loss.
Zacks Investment Management, Inc. is a wholly-owned subsidiary of Zacks Investment Research. Zacks Investment Management is an independent Registered Investment Advisory firm and acts as an investment manager for individuals and institutions. Zacks Investment Research is a provider of earnings data and other financial data to institutions and to individuals.
This material is being provided for informational purposes only and nothing herein constitutes investment, legal, accounting or tax advice, or a recommendation to buy, sell or hold a security. Do not act or rely upon the information and advice given in this publication without seeking the services of competent and professional legal, tax, or accounting counsel. Publication and distribution of this article is not intended to create, and the information contained herein does not constitute, an attorney-client relationship. No recommendation or advice is being given as to whether any investment or strategy is suitable for a particular investor. It should not be assumed that any investments in securities, companies, sectors or markets identified and described were or will be profitable. All information is current as of the date of herein and is subject to change without notice. Any views or opinions expressed may not reflect those of the firm as a whole.
Any projections, targets, or estimates in this report are forward looking statements and are based on the firm’s research, analysis, and assumptions. Due to rapidly changing market conditions and the complexity of investment decisions, supplemental information and other sources may be required to make informed investment decisions based on your individual investment objectives and suitability specifications. All expressions of opinions are subject to change without notice. Clients should seek financial advice regarding the appropriateness of investing in any security or investment strategy discussed in this presentation.
Certain economic and market information contained herein has been obtained from published sources prepared by other parties. Zacks Investment Management does not assume any responsibility for the accuracy or completeness of such information. Further, no third party has assumed responsibility for independently verifying the information contained herein and accordingly no such persons make any representations with respect to the accuracy, completeness or reasonableness of the information provided herein. Unless otherwise indicated, market analysis and conclusions are based upon opinions or assumptions that Zacks Investment Management considers to be reasonable. Any investment inherently involves a high degree of risk, beyond any specific risks discussed herein.
The S&P 500 Index is a well-known, unmanaged index of the prices of 500 large-company common stocks, mainly blue-chip stocks, selected by Standard & Poor’s. The S&P 500 Index assumes reinvestment of dividends but does not reflect advisory fees. The volatility of the benchmark may be materially different from the individual performance obtained by a specific investor. An investor cannot invest directly in an index.