The Bond Market and the Federal Reserve Don’t Control the Stock Market
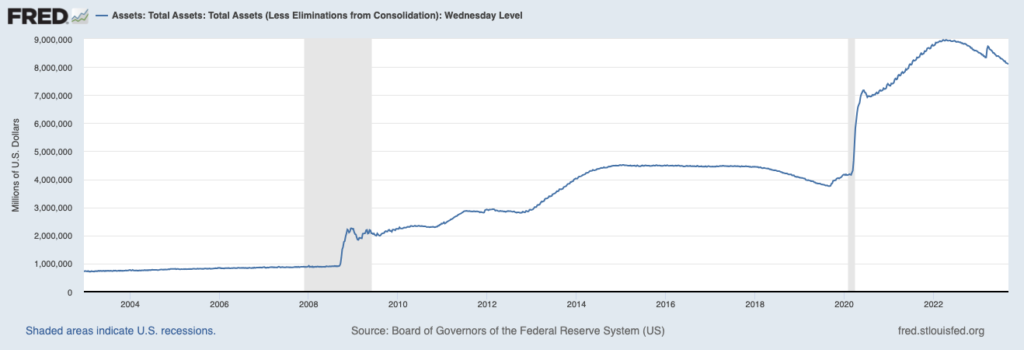
In the years following the 2008 Global Financial Crisis, the Federal Reserve cut short-term interest rates to the zero bound and engaged in “quantitative easing (QE)” to apply downward pressure on long-term interest rates. To execute QE, the Fed bought long-term Treasurys and mortgage-backed securities in very large numbers, ballooning the central bank’s balance sheet in the process. Popular thinking about these measures was that investors were forced into risk assets since yield was diminished in fixed-income markets.1
The Fed’s Balance Sheet – Expands Throughout the 2010s, Soars in 2020
I’m not saying this line of thinking is wrong. Easy money supercharged capital flows into stocks and other risk assets. Investors in search of yield had limited options in the bond markets, and massive amounts of liquidity meant more money was sloshing around in the capital markets. Much of it made its way into stocks.
But the thinking that the Fed was the only reason stocks did well in the 2010s and after 2020 is flawed, in my view. If this theory were true, it would mean quantitative tightening (QT) and rising interest rates would in turn be bearish for stocks, right? But that’s not what we’re seeing.
The Fed’s balance sheet peaked in April 2022 and has fallen by nearly $1.5 trillion since then. In that time, bond yields have also marched higher, with the 10-year U.S. Treasury bond moving from approximately 2.30% to its current 4.10%. So taken together, we have nearly two years’ worth of quantitative tightening on the books, with bond yields nearly doubling in that time. This prolonged tightening period should have been treacherous for stocks. But it wasn’t.
We know that 2022 featured a bear market, but it ended in October of that year while QT, aggressive rate hikes, and rising bond yields were ongoing. As seen in the chart below (pay particular attention to the green box), the Fed’s balance sheet (blue line) has been progressively shrinking – save for a brief uptick during regional bank stress – while the stock market (red line) has been rallying strongly.
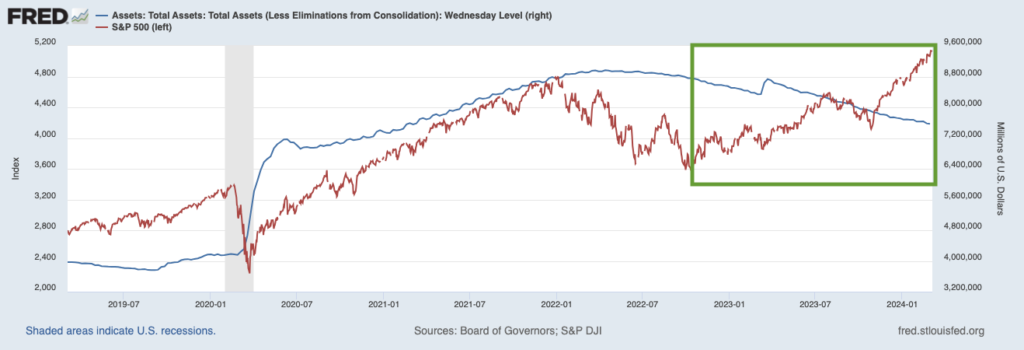
In 2024, bond yields have been moving modestly higher, which many would assume should factor as a negative for stocks. But stocks have managed to hit new all-time highs in the new year. The point to make once again is that falling bond yields and QE were not solely responsible for stocks’ strong gains over the past 15 years or so, just like rising bond yields and QT should not prevent stocks from reaching new all-time highs.
Bottom Line for Investors
The argument that the Fed and bond yields matter immensely to stock market performance is missing something glaring: the role of corporate earnings and economic growth. Aggregate S&P 500 earnings-per-share grew steadily from 2009 to 2015, contracted slightly, and then trended sharply higher up until the end of 2019. Aggregate EPS for S&P 500 companies more than doubled in this period, with profit margins reaching their highest point in decades by 2022. Zooming out even further, we know that year-over-year operating EPS growth averaged 7.1% from 2001 to 2022, which is almost perfectly in line with the S&P 500’s 7.01% annualized return over that same period.4 In short, stocks were propelled by much more than just the Fed and will continue to be as QT continues, in my view.5
Disclosure
2 Fred Economic Data. February 29, 2024. https://fred.stlouisfed.org/series/WALCL#
3 Fred Economic Data. February 29, 2024. https://fred.stlouisfed.org/series/WALCL
4 J.P. Morgan. 2024. https://am.jpmorgan.com/us/en/asset-management/adv/insights/market-insights/guide-to-the-markets/?gclid=Cj0KCQjwmICoBhDxARIsABXkXlKEwzu1pOK4ldrG0WzcPVDn1jeam7dSUKFu_7tFO9SbwNAwzFwb9aMaArH1EALw_wcB&gclsrc=aw.ds
5 Moneychimp. 2024. http://www.moneychimp.com/features/market_cagr.htm
DISCLOSURE
Past performance is no guarantee of future results. Inherent in any investment is the potential for loss.
Zacks Investment Management, Inc. is a wholly-owned subsidiary of Zacks Investment Research. Zacks Investment Management is an independent Registered Investment Advisory firm and acts as an investment manager for individuals and institutions. Zacks Investment Research is a provider of earnings data and other financial data to institutions and to individuals.
This material is being provided for informational purposes only and nothing herein constitutes investment, legal, accounting or tax advice, or a recommendation to buy, sell or hold a security. Do not act or rely upon the information and advice given in this publication without seeking the services of competent and professional legal, tax, or accounting counsel. Publication and distribution of this article is not intended to create, and the information contained herein does not constitute, an attorney-client relationship. No recommendation or advice is being given as to whether any investment or strategy is suitable for a particular investor. It should not be assumed that any investments in securities, companies, sectors or markets identified and described were or will be profitable. All information is current as of the date of herein and is subject to change without notice. Any views or opinions expressed may not reflect those of the firm as a whole.
Any projections, targets, or estimates in this report are forward looking statements and are based on the firm’s research, analysis, and assumptions. Due to rapidly changing market conditions and the complexity of investment decisions, supplemental information and other sources may be required to make informed investment decisions based on your individual investment objectives and suitability specifications. All expressions of opinions are subject to change without notice. Clients should seek financial advice regarding the appropriateness of investing in any security or investment strategy discussed in this presentation.
Certain economic and market information contained herein has been obtained from published sources prepared by other parties. Zacks Investment Management does not assume any responsibility for the accuracy or completeness of such information. Further, no third party has assumed responsibility for independently verifying the information contained herein and accordingly no such persons make any representations with respect to the accuracy, completeness or reasonableness of the information provided herein. Unless otherwise indicated, market analysis and conclusions are based upon opinions or assumptions that Zacks Investment Management considers to be reasonable. Any investment inherently involves a high degree of risk, beyond any specific risks discussed herein.
The S&P 500 Index is a well-known, unmanaged index of the prices of 500 large-company common stocks, mainly blue-chip stocks, selected by Standard & Poor’s. The S&P 500 Index assumes reinvestment of dividends but does not reflect advisory fees. The volatility of the benchmark may be materially different from the individual performance obtained by a specific investor. An investor cannot invest directly in an index.
The Russell 1000 Growth Index is a well-known, unmanaged index of the prices of 1000 large-company growth common stocks selected by Russell. The Russell 1000 Growth Index assumes reinvestment of dividends but does not reflect advisory fees. An investor cannot invest directly in an index. The volatility of the benchmark may be materially different from the individual performance obtained by a specific investor.
Nasdaq Composite Index is the market capitalization-weighted index of over 3,300 common equities listed on the Nasdaq stock exchange. The types of securities in the index include American depositary receipts, common stocks, real estate investment trusts (REITs) and tracking stocks, as well as limited partnership interests. The index includes all Nasdaq-listed stocks that are not derivatives, preferred shares, funds, exchange-traded funds (ETFs) or debenture securities. An investor cannot invest directly in an index. The volatility of the benchmark may be materially different from the individual performance obtained by a specific investor.
The Dow Jones Industrial Average measures the daily stock market movements of 30 U.S. publicly-traded companies listed on the NASDAQ or the New York Stock Exchange (NYSE). The 30 publicly-owned companies are considered leaders in the United States economy. An investor cannot directly invest in an index. The volatility of the benchmark may be materially different from the individual performance obtained by a specific investor.
The Bloomberg Global Aggregate Index is a flagship measure of global investment grade debt from twenty-four local currency markets. This multi-currency benchmark includes treasury, government-related, corporate and securitized fixed-rate bonds from both developed and emerging markets issuers. An investor cannot invest directly in an index. The volatility of the benchmark may be materially different from the individual performance obtained by a specific investor.
The ICE Exchange-Listed Fixed & Adjustable Rate Preferred Securities Index is a modified market capitalization weighted index composed of preferred stock and securities that are functionally equivalent to preferred stock including, but not limited to, depositary preferred securities, perpetual subordinated debt and certain securities issued by banks and other financial institutions that are eligible for capital treatment with respect to such instruments akin to that received for issuance of straight preferred stock. An investor cannot invest directly in an index. The volatility of the benchmark may be materially different from the individual performance obtained by a specific investor.
The MSCI ACWI ex U.S. Index captures large and mid-cap representation across 22 of 23 Developed Markets (DM) countries (excluding the United States) and 24 Emerging Markets (EM) countries. The index covers approximately 85% of the global equity opportunity set outside the U.S. An investor cannot invest directly in an index. The volatility of the benchmark may be materially different from the individual performance obtained by a specific investor.
The Russell 2000 Index is a well-known, unmanaged index of the prices of 2000 small-cap company common stocks, selected by Russell. The Russell 2000 Index assumes reinvestment of dividends but does not reflect advisory fees. An investor cannot invest directly in an index. The volatility of the benchmark may be materially different from the individual performance obtained by a specific investor.
The S&P Mid Cap 400 provides investors with a benchmark for mid-sized companies. The index, which is distinct from the large-cap S&P 500, is designed to measure the performance of 400 mid-sized companies, reflecting the distinctive risk and return characteristics of this market segment.
The S&P 500 Pure Value index is a style-concentrated index designed to track the performance of stocks that exhibit the strongest value characteristics by using a style-attractiveness-weighting scheme. An investor cannot directly invest in an index. The volatility of the benchmark may be materially different from the individual performance obtained by a specific investor.