A more appropriate title for this week’s column might be, “The 3 Most Important Stock Market Indicators That Few People Talk About.” If you are a regular reader of my column or are a Zacks Investment Management client, you know that corporate earnings are the single most influential indicator we use to make investment decisions. We developed a proprietary system for analyzing earnings and earnings revisions that guides our buy and sell discipline, and it’s a key tenet of our Pure Investing philosophy. I won’t get into those details here, but since you won’t find corporate earnings in my “3 Most Important” indicators below, I wanted to make sure I got that point across.
And before I jump into the indicators that we believe are very important but that few people talk about, let me just take a moment to share a piece of data on corporate earnings that really reinforces my bullish outlook.
During the first two months of the first quarter, analysts actually increased earnings estimates for companies in the S&P 500. The Q1 bottom-up earnings-per-share estimate (which is an aggregation of the median EPS estimates for all companies in the index) rose by +5.7%. That number is hugely significant, in my view. We know that on average, the bottom-up EPS estimate usually decreases during the first two months of a quarter. Companies tend to want to downplay their earnings outlook, to keep expectations on the conservative side. Indeed, during the past ten years, (40 quarters), the bottom-up EPS estimate recorded an average decline of -4.0% during the first two months of a quarter. This time, estimates are up +5.7% (according to Factset).
In short, the outlook, to us, appears quite rosy.
The 3 Important Indicators that Few People Talk About:
1. Leading Economic Indicators
We believe that the Conference Board Leading Economic Index (LEI) is arguably one of the most underrated macroeconomic metrics/indicators out there. If you try to find an instance where the LEI was going up and the economy fell into a recession, you wouldn’t find one. Any time the LEI is high and rising, the economy has grown. It makes sense then that the key elements of the LEI are designed to signal peaks and troughs in the business cycle. It coincidentally looks at factors like manufacturers’ new orders, building permits, the interest rate spread, weekly claims for unemployment insurance, amongst a few others. These are all indicators that may be able to offer forward-looking insights into economic activity, versus a metric like GDP that looks backward.
As of this writing, the LEI is high and rising – another good sign, for now (according to Conference Board LEI).
2. The Yield Curve
Regular readers have seen me mention the yield curve before, and I do so again to drive home its importance. A flattening yield curve generally tends to indicate that a slowdown lies ahead, and that’s exactly what we’ve been seeing over the last few years. A recession does not necessarily follow a flat or inverted yield curve immediately, however. On average, the yield curve inverts 16 months prior to an economic recession and 13 months before major stock-market corrections (according to Silverlight Invest). As you can see below, we are not quite to inversion yet – the blue line (today’s yield curve) is notably flatter than the green line (the yield curve at the beginning of 2010). If the yield curve continues to flatten and eventually inverts, it could be a major warning signal in our opinion. (according to data from the US Department of the Treasury).
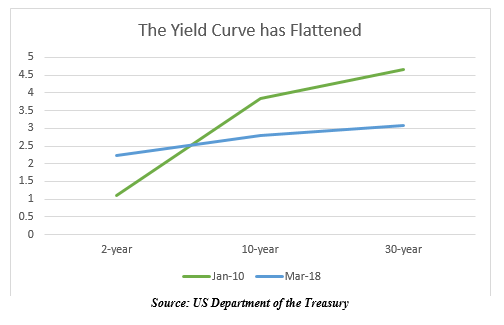
Source: US Department of the Treasury
3. Investor Sentiment
This indicator is more qualitative than quantitative. One can measure investor sentiment somewhat by looking at University of Michigan Consumer Confidence numbers, and there are other indices that attempt to measure investors’ comfort with risk. But in reality, this indicator relies more on intuition than data.
The two most recent bear markets provide useful examples. The 2000 tech bubble, of course, is notorious for wildly overpriced IPOs and investors’ blindly throwing darts at start-ups in an attempt to make fast money. In 2008, the “euphoria” in investor sentiment came not from people overbuying and overpaying for stocks, but in consumer credit gone wild in subprime mortgages, home equity lines of credit, and ultimately massive defaults. That “bubble” was a bit harder to spot, but the road still led to overenthusiastic investors and consumers.
A key question with this indicator is, are investors getting too comfortable with risk?
Bottom Line for Investors
Fortunately for investors, I believe that all three of my aforementioned indicators seem to be on solid footing, for now. The LEI is high and rising, the yield curve is flattening but not yet inverted, and investors aren’t quite “euphoric” about this market, in my opinion. I believe we are teetering towards a moment when all three could signal more bearish conditions, however, and it makes these indicators worth watching closely.
To help you keep an eye on these indicators and other market insights, you can download a free copy of our Stock Market Outlook(1)
Disclosure
Past performance is no guarantee of future results. Inherent in any investment is the potential for loss.
Zacks Investment Management, Inc. is a wholly-owned subsidiary of Zacks Investment Research. Zacks Investment Management is an independent Registered Investment Advisory firm and acts as an investment manager for individuals and institutions. Zacks Investment Research is a provider of earnings data and other financial data to institutions and to individuals.
This material is being provided for informational purposes only and nothing herein constitutes investment, legal, accounting or tax advice, or a recommendation to buy, sell or hold a security. Do not act or rely upon the information and advice given in this publication without seeking the services of competent and professional legal, tax, or accounting counsel. The information contained herein has been obtained from sources believed to be reliable but we do not guarantee accuracy or completeness. Publication and distribution of this article is not intended to create, and the information contained herein does not constitute, an attorney-client relationship. No recommendation or advice is being given as to whether any investment or strategy is suitable for a particular investor. It should not be assumed that any investments in securities, companies, sectors or markets identified and described were or will be profitable. All information is current as of the date of herein and is subject to change without notice. Any views or opinions expressed may not reflect those of the firm as a whole.
Any projections, targets, or estimates in this report are forward looking statements and are based on the firm’s research, analysis, and assumptions. Due to rapidly changing market conditions and the complexity of investment decisions, supplemental information and other sources may be required to make informed investment decisions based on your individual investment objectives and suitability specifications. All expressions of opinions are subject to change without notice. Clients should seek financial advice regarding the appropriateness of investing in any security or investment strategy discussed in this presentation.
Certain economic and market information contained herein has been obtained from published sources prepared by other parties. Zacks Investment Management does not assume any responsibility for the accuracy or completeness of such information. Further, no third party has assumed responsibility for independently verifying the information contained herein and accordingly no such persons make any representations with respect to the accuracy, completeness or reasonableness of the information provided herein. Unless otherwise indicated, market analysis and conclusions are based upon opinions or assumptions that Zacks Investment Management considers to be reasonable.
(1) Zacks Investment Management reserves the right to amend the terms or rescind the free Stock Market Outlook offer at any time and for any reason at its discretion.