Official statistics from the Bureau of Economic Analysis show the U.S. economy contracted by -1.6% in the first quarter and then again by -0.9% in Q2.1 These data points meet the technical definition of a recession, which is two consecutive quarters of negative GDP growth. But that does not mean the U.S. was actually in recession. That’s a determination made by the National Bureau of Economic Research (NBER), and they consider a wider range of factors beyond GDP, like productivity, gains or losses in the jobs market, and wages.
Considering the strength of the U.S. jobs market, rising wages, and robust consumer spending over the past year, I do not believe the US economy entered a recession in the first half of 2022. But looking ahead to the rest of the year, three important leading indicators are starting to send early warning signals. I think they’re worth keeping an eye on.
__________________________________________________________________________
Are You Fearing a Potential Recession? Here’s What to Do
Here’s a reminder for long-term investors – don’t base your investing decisions on fear and short-term choices! Even in a market that is signaling a potential recession, I believe that learning how to protect your investments is a major key.
Protecting your investments requires sticking to fundamentals, quality, and diversification. To help you accomplish this, I’m offering all long-term investors our Just-Released September 2022 Stock Market Outlook Report, which contains some of our key forecasts to consider such as:
- August Sell-Side and Buy-Side Consensus
- Zacks Rank August Industry Tables
- Zacks Forecasts at a Glance
- What’s Next for the Market?
- And more…
If you have $500,000 or more to invest and want to learn more about these forecasts, click on the link below to get your free report today!
IT’S FREE. Download the Just-Released September 2022 Stock Market Outlook2
- Inverted Yield Curve
The 3-month and 2-year U.S. Treasury bond yields have bounced sharply off lows and are moving in a noticeable uptrend. Short-duration Treasury bond yields tend to rise when investors anticipate tighter central bank policies, which is essentially confirmation of what we already knew – i.e., the Fed has turned hawkish in an effort to tamp down inflation.
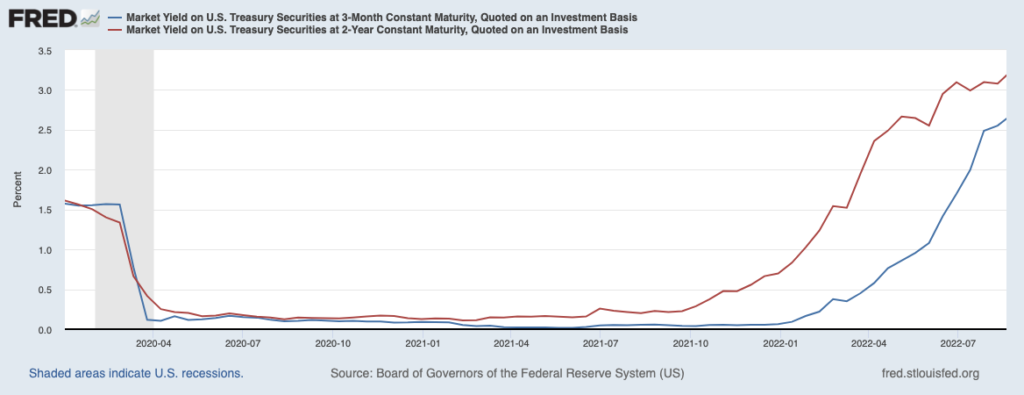
One of the risks posed by rising short-duration Treasury bond yields is their effect on the yield curve. As a quick refresher, the yield curve represents the difference between long-term and short-term interest rates, which also serves as a proxy for loan profitability for banks. Since banks borrow at short-duration rates and lend at long-term rates (generally speaking), a steep yield curve creates higher net interest margins, which usually results in more credit, loans, and economic activity. On the flip side, an inverted yield curve signals it is more expensive to borrow money short-term than long-term, which means something is likely awry in the credit markets.
Historically, the yield curve has been a good forward-looking indicator for the economy, which is why rapidly rising short-duration U.S. Treasury bond yields are worth watching closely. In the chart below, the yield curve is presented as the 10-year U.S. Treasury bond yield minus the 3-month U.S. Treasury bond yield. A declining line means the yield curve is flattening, and if the line falls below 0%, it means the yield curve is inverted. As seen below, any time the 3-month/10-year yield curve has inverted (fallen below zero on the chart), a recession has followed.
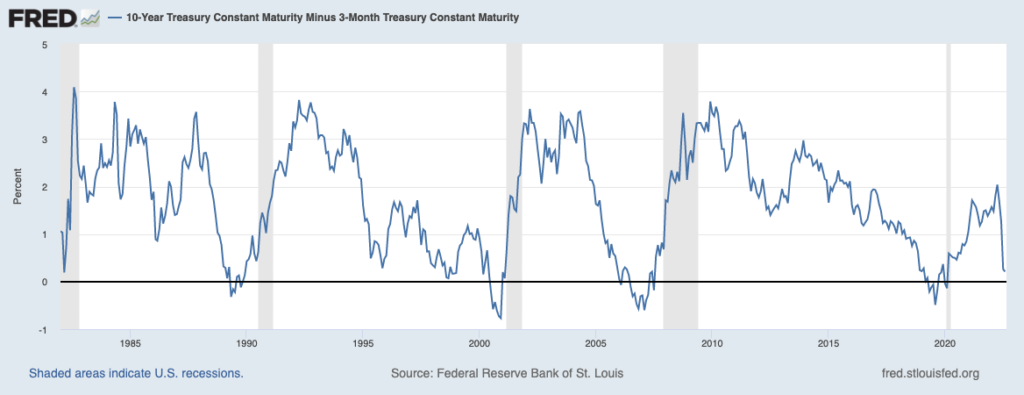
In the current environment, the yield curve is not quite inverted just yet. But it’s getting close.
- Declining Conference Board Leading Economic Index
Consecutive declines in the Conference Board’s Leading Economic Index (LEI) have historically been a precursor to economic contractions. In July, the Conference Board LEI fell by 0.4%, which followed a -0.7% decline in June. Importantly, the LEI has fallen over the past six months by -1.6%, which indicates a greater trend and is worth monitoring.5
The key factors that appear to be driving the LEI lower are pessimistic US consumers, a slight dip in manufacturing orders, a slowing of housing permits and construction, and of course, the bear market. The Conference Board LEI includes the S&P 500 index, so the downdraft in the first half was a significant factor pulling down the LEI prints. The next couple of months will be important in determining whether this downtrend is sustained, which could signal a recession perhaps later in the year. Again, we’re not there yet.
- Rising Initial Jobless Claims
Initial jobless claims are a measure of how many new applications for unemployment benefits are submitted every week. This metric is a useful leading indicator because the data is high frequency, and also because it signals whether layoffs in the broad economy are starting to trend higher. A consistently rising initial jobless claims number signals the jobs market may be weakening, which usually means the economy is weakening, too. In the last six recessions, initial jobless claims started to trend higher about six months before the recession took hold. As readers can see in the two charts below, initial claims appear to have bottomed in March, and the 4-week moving average is trending slightly higher.
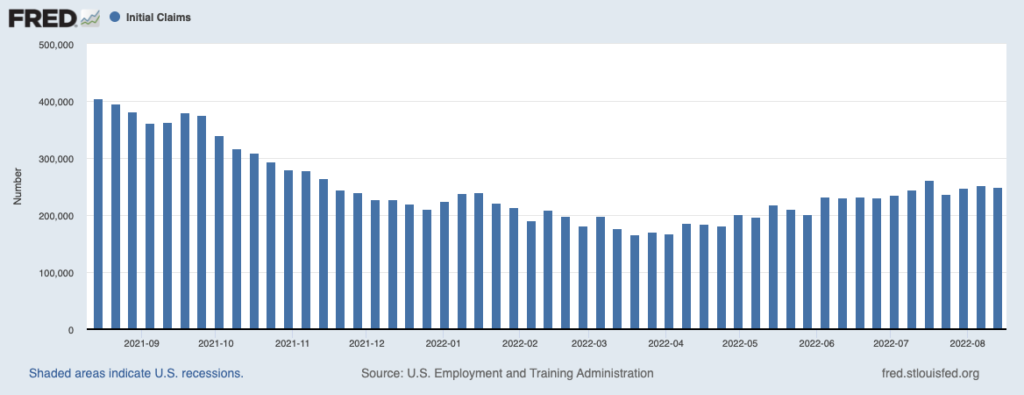
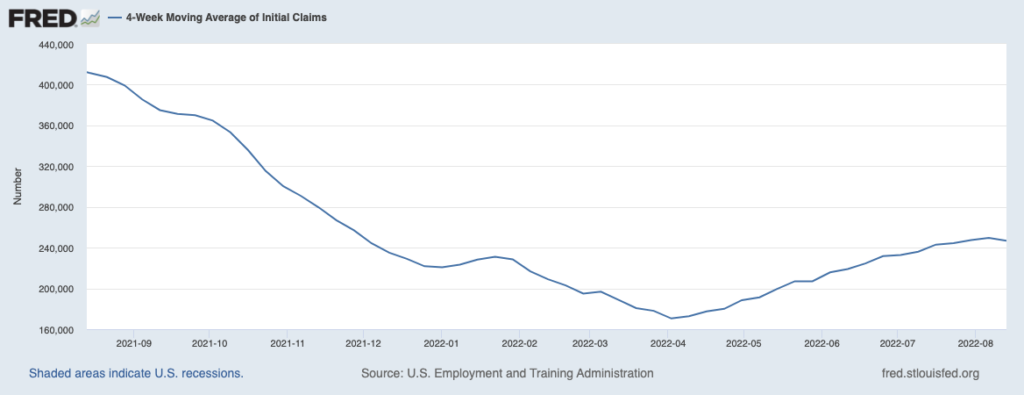
The upshot here is that initial claims are coming off historically low levels, and the number of available jobs in the U.S. economy continues to hover around 10 million. Worker shortages – not worker gluts – are still the prevailing issue in business.
Bottom Line for Investors
None of the above indicators are perfect recession forecasters, but they do help paint a picture of how the economy is holding up overall. In the current context, none of these indicators is flashing red, but they do seem to indicate more challenging growth conditions in the months ahead. For investors, this possibility does not necessarily translate to the need for allocation shifts within a portfolio. The stock market is a discounter of future growth conditions, and it is very possible that the drawdown in the first half – and the ongoing choppiness today – is the market already pricing in this economic weakness. By the time the recession arrives, if it ever does, the market may already have moved on.
To keep your investments protected and on track through any outcome, I recommend focusing on data that contributes to your long-term goals. To help you get started, I am offering all readers our Just-Released September 2022 Stock Market Outlook Report.
This special report was created to help you better prepare your investments for any market changes. It contains some of our key forecasts to consider such as:
- August Sell-Side and Buy-Side Consensus
- Zacks Rank August Industry Tables
- Zacks Forecasts at a Glance
- What’s Next for the Market?
- And more…
If you have $500,000 or more to invest and want to learn more about these forecasts, click on the link below to get your free report today!
Disclosure
2 Zacks Investment Management reserves the right to amend the terms or rescind the free Stock Market Outlook offer at any time and for any reason at its discretion.
3 Fred Economic Data. August 19, 2022. https://fred.stlouisfed.org/series/DGS3MO#
4 Fred Economic Data. August 22, 2022. https://fred.stlouisfed.org/series/T10Y3M#
5 Conference Board. August 18, 2022. https://www.conference-board.org/topics/us-leading-indicators
6 Fred Economic Data. August 18, 2022. https://fred.stlouisfed.org/series/ICSA#
7 Fred Economic Data. August 18, 2022. https://fred.stlouisfed.org/series/IC4WSA#
8 Zacks Investment Management reserves the right to amend the terms or rescind the free Stock Market Outlook offer at any time and for any reason at its discretion.
DISCLOSURE
Past performance is no guarantee of future results. Inherent in any investment is the potential for loss.
Zacks Investment Management, Inc. is a wholly-owned subsidiary of Zacks Investment Research. Zacks Investment Management is an independent Registered Investment Advisory firm and acts as an investment manager for individuals and institutions. Zacks Investment Research is a provider of earnings data and other financial data to institutions and to individuals.
This material is being provided for informational purposes only and nothing herein constitutes investment, legal, accounting or tax advice, or a recommendation to buy, sell or hold a security. Do not act or rely upon the information and advice given in this publication without seeking the services of competent and professional legal, tax, or accounting counsel. Publication and distribution of this article is not intended to create, and the information contained herein does not constitute, an attorney-client relationship. No recommendation or advice is being given as to whether any investment or strategy is suitable for a particular investor. It should not be assumed that any investments in securities, companies, sectors or markets identified and described were or will be profitable. All information is current as of the date of herein and is subject to change without notice. Any views or opinions expressed may not reflect those of the firm as a whole.
Any projections, targets, or estimates in this report are forward looking statements and are based on the firm’s research, analysis, and assumptions. Due to rapidly changing market conditions and the complexity of investment decisions, supplemental information and other sources may be required to make informed investment decisions based on your individual investment objectives and suitability specifications. All expressions of opinions are subject to change without notice. Clients should seek financial advice regarding the appropriateness of investing in any security or investment strategy discussed in this presentation.
Certain economic and market information contained herein has been obtained from published sources prepared by other parties. Zacks Investment Management does not assume any responsibility for the accuracy or completeness of such information. Further, no third party has assumed responsibility for independently verifying the information contained herein and accordingly no such persons make any representations with respect to the accuracy, completeness or reasonableness of the information provided herein. Unless otherwise indicated, market analysis and conclusions are based upon opinions or assumptions that Zacks Investment Management considers to be reasonable. Any investment inherently involves a high degree of risk, beyond any specific risks discussed herein.
The S&P 500 Index is a well-known, unmanaged index of the prices of 500 large-company common stocks, mainly blue-chip stocks, selected by Standard & Poor’s. The S&P 500 Index assumes reinvestment of dividends but does not reflect advisory fees. The volatility of the benchmark may be materially different from the individual performance obtained by a specific investor. An investor cannot invest directly in an index.
The Russell 1000 Growth Index is a well-known, unmanaged index of the prices of 1000 large-company growth common stocks selected by Russell. The Russell 1000 Growth Index assumes reinvestment of dividends but does not reflect advisory fees. An investor cannot invest directly in an index. The volatility of the benchmark may be materially different from the individual performance obtained by a specific investor.
Nasdaq Composite Index is the market capitalization-weighted index of over 3,300 common equities listed on the Nasdaq stock exchange. The types of securities in the index include American depositary receipts, common stocks, real estate investment trusts (REITs) and tracking stocks, as well as limited partnership interests. The index includes all Nasdaq-listed stocks that are not derivatives, preferred shares, funds, exchange-traded funds (ETFs) or debenture securities. An investor cannot invest directly in an index. The volatility of the benchmark may be materially different from the individual performance obtained by a specific investor.
The Dow Jones Industrial Average measures the daily stock market movements of 30 U.S. publicly-traded companies listed on the NASDAQ or the New York Stock Exchange (NYSE). The 30 publicly-owned companies are considered leaders in the United States economy. An investor cannot directly invest in an index. The volatility of the benchmark may be materially different from the individual performance obtained by a specific investor.