America’s Debt Crossed 100% of GDP—Now What?
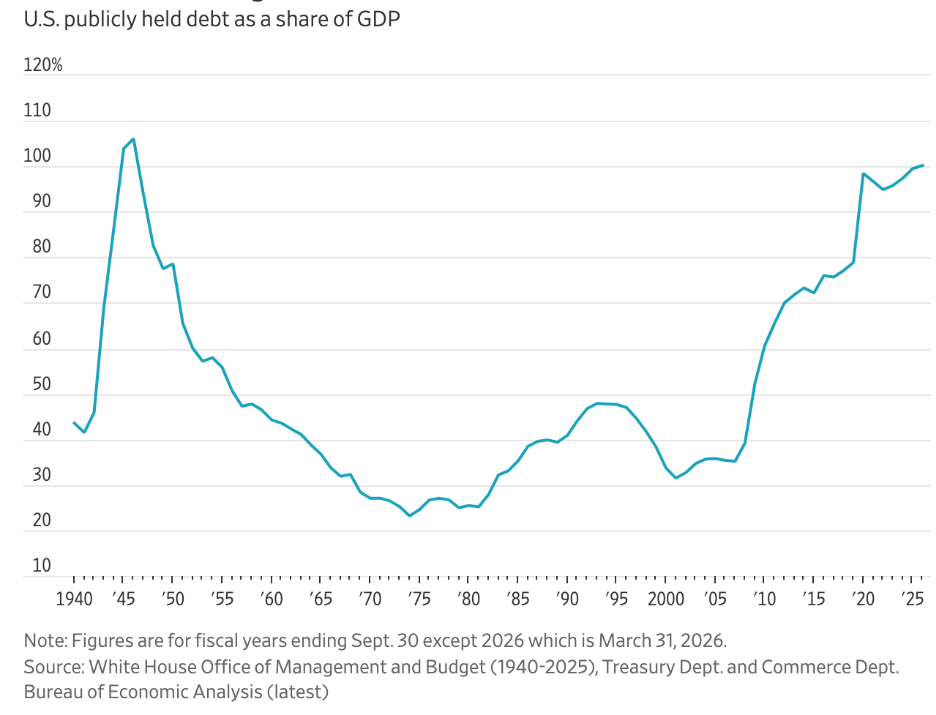
The chart below has made the rounds over the past week, as the U.S. national debt has officially surpassed 100% of gross domestic product (GDP). Outside of a brief spike during the pandemic, the U.S. has not ended a fiscal year above the 100% mark since the aftermath of World War II.1
Investors are understandably concerned. Federal deficits remain historically large, while rising interest rates have increased the cost of servicing that debt. In 2026, the deficit is projected to reach nearly $2 trillion, with roughly one out of every seven taxpayer dollars going toward interest payments.
Uncertainty in this Market is Normal. Download Our May Insights to Guide Your Next Steps
With debt levels rising and interest rate expectations continuing to shift, investors may be entering a more selective market environment.
Our latest May Stock Market Outlook Report3 explores what these trends could mean for portfolios and the opportunities that may still exist ahead. Inside, you’ll learn:
- Asset allocation guidelines for today’s market environment
- Expert forecasts for inflation, rates, and economic trends
- Industry tables and rankings to help you spot opportunities
- Buy-side and sell-side consensus insights at a glance
- And much more!
If you have $500,000 or more to invest, claim your complimentary copy of the report and see how shifting market trends could influence opportunities in the months ahead.
IT’S FREE. Download our latest Stock Market Outlook Report3
This is not an issue to be dismissive about, in my view. The long-term fiscal trajectory of the United States is an issue policymakers will eventually need to address, particularly as an aging population places additional pressure on programs like Social Security and Medicare. This comes at a time when political problems have become increasingly difficult to solve.
That all being said, I also think it is important to separate the symbolism of crossing 100% debt-to-GDP from the actual near-term implications for markets and the economy.
One reason is that debt-to-GDP, while widely cited, is an imperfect standalone measure of fiscal stress in the U.S. GDP measures one year of economic output, while federal debt is the cumulative result of borrowing built up over decades. Comparing the two can provide useful context, but it does not necessarily tell us whether a debt burden has become immediately unmanageable.
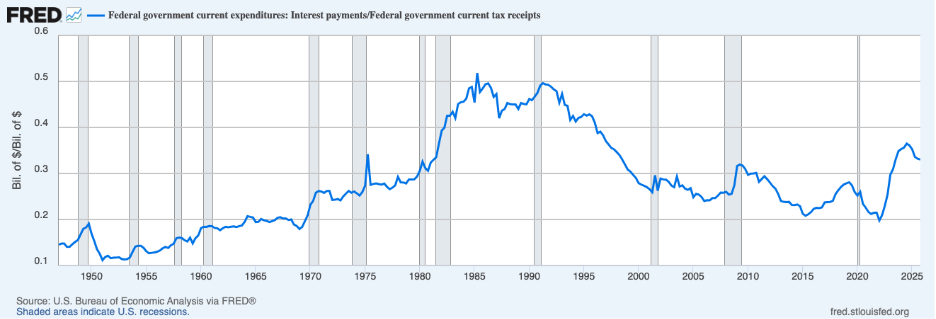
Market participants rightly focus more closely on the government’s ability to service its debt, particularly the relationship between interest payments and tax receipts. As the chart below shows, interest costs as a share of government revenues have risen meaningfully in recent years. But they also remain below peaks reached during the 1980s and early 1990s, which were periods marked by elevated interest rates and fiscal concerns.
Federal Government Interest Payments as a Share of Federal Tax Receipts
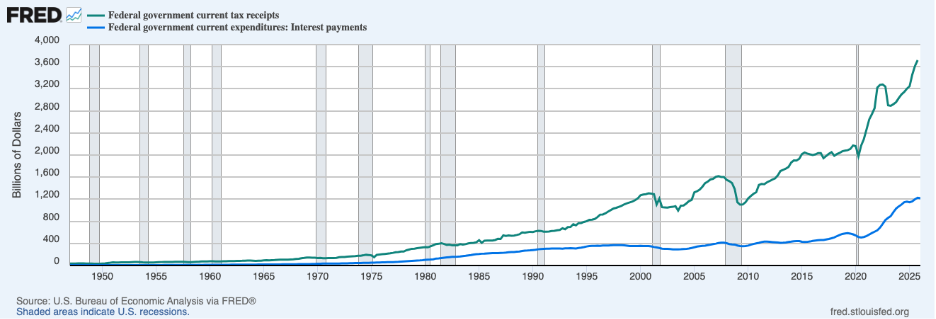
If we look at this data another way, by comparing annual federal tax receipts (green line, chart below) to annual interest payments on government debt (blue line, chart below), you can see that the government has plenty of means to stay current on debt payments. This is also why markets are not yet treating U.S. debt as a near-term solvency issue.
U.S. equity markets have risen throughout this rapid debt accumulation period, and importantly, the 10-year Treasury yield remains below its long-term historical average. Demand for U.S. Treasurys remains strong globally, supported by the dollar’s role as the world’s reserve currency and the Treasury market’s position at the center of the global financial system. I do not think we’d see this type of reaction from markets if the 100% debt-to-GDP ratio was a meaningful metric.
Bottom Line for Investors
History offers an important perspective. The last time the debt-to-GDP ratio exceeded current levels was in 1946, when debt reached more than 106% of GDP following World War II. That burden eventually declined not because the government aggressively paid down debt, but because economic growth, inflation, and rising productivity allowed the economy to outgrow it over time.
Crossing the 100% debt-to-GDP threshold is therefore best viewed less as an immediate market signal and more as a reminder of a long-term challenge that will eventually require political and economic adjustment. The more relevant questions for investors are whether the U.S. can continue financing its obligations sustainably, whether economic growth remains resilient, and whether markets maintain confidence in the broader system. At least for now, those conditions largely remain in place.
As investors continue evaluating these trends and their potential impact on markets, our latest Stock Market Outlook Report6 explores the forces shaping today’s investment landscape and what may be worth watching in the months ahead. Our exclusive report includes:
- Asset allocation guidelines for today’s market environment
- Expert forecasts for inflation, rates, and economic trends
- Industry tables and rankings to help you spot opportunities
- Buy-side and sell-side consensus insights at a glance
- And much more!
If you have $500,000 or more to invest, claim your complimentary copy of the report and see how shifting market trends could influence opportunities in the months ahead.
Disclosure
2 Wall Street Journal. April 30, 2026. https://www.wsj.com/economy/u-s-debt-tops-100-of-gdp-81c013d7?mod=economy_trendingnow_article_pos1
3 Zacks Investment Management reserves the right to amend the terms or rescind the free-Stock Market Outlook Report offer at any time and for any reason at its discretion.
4 Fred Economic Data. April 30, 2026. https://www.wsj.com/economy/u-s-debt-tops-100-of-gdp-81c013d7?mod=economy_trendingnow_article_pos1
5 Fred Economic Data. April 9, 2026. https://fred.stlouisfed.org/series/W006RC1Q027SBEA
6 Zacks Investment Management reserves the right to amend the terms or rescind the free-Stock Market Outlook Report offer at any time and for any reason at its discretion.
DISCLOSURE
Past performance is no guarantee of future results. Inherent in any investment is the potential for loss.
Zacks Investment Management, Inc. is a wholly-owned subsidiary of Zacks Investment Research. Zacks Investment Management is an independent Registered Investment Advisory firm and acts as an investment manager for individuals and institutions. Zacks Investment Research is a provider of earnings data and other financial data to institutions and to individuals.
This material is being provided for informational purposes only and nothing herein constitutes investment, legal, accounting or tax advice, or a recommendation to buy, sell or hold a security. Do not act or rely upon the information and advice given in this publication without seeking the services of competent and professional legal, tax, or accounting counsel. Publication and distribution of this article is not intended to create, and the information contained herein does not constitute, an attorney-client relationship. No recommendation or advice is being given as to whether any investment or strategy is suitable for a particular investor. It should not be assumed that any investments in securities, companies, sectors or markets identified and described were or will be profitable. All information is current as of the date of herein and is subject to change without notice. Any views or opinions expressed may not reflect those of the firm as a whole.
Any projections, targets, or estimates in this report are forward looking statements and are based on the firm’s research, analysis, and assumptions. Due to rapidly changing market conditions and the complexity of investment decisions, supplemental information and other sources may be required to make informed investment decisions based on your individual investment objectives and suitability specifications. All expressions of opinions are subject to change without notice. Clients should seek financial advice regarding the appropriateness of investing in any security or investment strategy discussed in this presentation.
Certain economic and market information contained herein has been obtained from published sources prepared by other parties. Zacks Investment Management does not assume any responsibility for the accuracy or completeness of such information. Further, no third party has assumed responsibility for independently verifying the information contained herein and accordingly no such persons make any representations with respect to the accuracy, completeness or reasonableness of the information provided herein. Unless otherwise indicated, market analysis and conclusions are based upon opinions or assumptions that Zacks Investment Management considers to be reasonable. Any investment inherently involves a high degree of risk, beyond any specific risks discussed herein.
The S&P 500 Index is a well-known, unmanaged index of the prices of 500 large-company common stocks, mainly blue-chip stocks, selected by Standard & Poor’s. The S&P 500 Index assumes reinvestment of dividends but does not reflect advisory fees. The volatility of the benchmark may be materially different from the individual performance obtained by a specific investor. An investor cannot invest directly in an index.
The Russell 2000 Index is a well-known, unmanaged index of the prices of 2000 small-cap company common stocks, selected by Russell. The Russell 2000 Index assumes reinvestment of dividends but does not reflect advisory fees. An investor cannot invest directly in an index. The volatility of the benchmark may be materially different from the individual performance obtained by a specific investor.
The Nasdaq Composite Index measures all Nasdaq domestic and international based common type stocks listed on The Nasdaq Stock Market. To be eligible for inclusion in the Index, the security's U.S. listing must be exclusively on The Nasdaq Stock Market (unless the security was dually listed on another U.S. market prior to January 1, 2004 and has continuously maintained such listing). The security types eligible for the Index include common stocks, ordinary shares, ADRs, shares of beneficial interest or limited partnership interests and tracking stocks. Security types not included in the Index are closed-end funds, convertible debentures, exchange traded funds, preferred stocks, rights, warrants, units and other derivative securities. An investor cannot invest directly in an index.