In today’s Steady Investor, we explore three timely developments shaping today’s market and economy, and why they matter for investors, including:
- Tariffs return, markets stay focused
- Inflation gauge may ease
- Private equity faces liquidity challenges
Tariffs are Coming Back, But Markets Have Seen This Movie Before – After a relatively quiet period following the Supreme Court ruling, tariff policy is moving back into focus. The current 10% global tariff (which President Trump was able to implement for a period of 150 days) is set to expire this week, and replacement duties are in the works. The new approach is expected to rely more heavily on Section 301, which is generally viewed as more legally durable than the emergency authority the Supreme Court rejected earlier this year.For businesses, this creates another round of uncertainty, as the proposed new tariffs could cover as much as 99% of U.S. trade with rates of 10% for more than a dozen trading partners and 12.5% for over 40 others. This week, the administration also threatened a 50% tariff on certain Canadian goods beginning August 19, covering roughly $20 billion of exports to the U.S. This latter set of tariffs carries a lot of headline risk, but for context, it covers just a small slice of the more than $380 billion in Canadian goods exported to America last year.As we’ve argued many times before, we view tariffs as an economic negative, as the cost is ultimately borne by importers, businesses, and consumers. For markets, however, the key question is whether this is new information—and in our view, it isn’t. The expected tariff levels appear broadly similar to those in place before the Supreme Court ruling, when the average U.S. tariff rate was around 17%, versus about 11% today under the temporary measures. Markets handled that earlier regime reasonably well, and we do not anticipate much of a reaction once new measures are put in place.1
A Disciplined Approach to Today’s Market
Economic data, policy changes, and market headlines can create uncertainty, but they shouldn’t drive every investment decision. A disciplined investment process can help investors separate short-term noise from long-term opportunity.
Our complimentary guide, Three Steps to Overcoming Investment Behavioral Bias2 provides practical strategies to help you invest with greater confidence and objectivity. Inside, you’ll learn:
- The two main types of biases that affect investors: Cognitive and Emotional
- Specific examples of biased decision-making that can negatively impact your portfolio
- Three essential actions you can take to counteract the natural investor tendencies toward bias
If you have $500,000 or more to invest, simply click on the link below to get your copy today!
Download Zacks Guide, Three Steps to Overcoming Investment Behavioral Bias2
A Statistical Change Could Temper the Fed’s Preferred Inflation Gauge – The Fed’s preferred inflation gauge may soon look a little ‘better,’ but not because prices are suddenly falling.The Bureau of Economic Analysis is preparing changes to how it measures three categories inside the personal-consumption expenditures (PCE) price index: software, investment-management services, and legal services. Economists estimate the revisions could lower core PCE inflation by roughly 0.2% to 0.3% when the August data are released on September 30.Some may wonder if this is the agency’s attempt to shift the narrative on inflation, but the reality is that statistical changes happen fairly regularly. In this case, it is notable that PCE has been running hotter than CPI, with economists estimating Core PCE near 3.3% in June versus core CPI at 2.6%.3
Core PCE (blue line) Has Run Substantially Hotter than Core CPI (green line) Recently
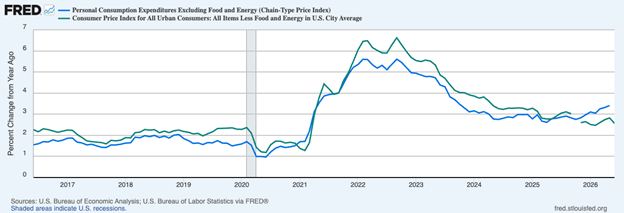
Part of the gap appears tied to quirky measurement issues. For example, the current software index has captured some price pressure from hardware items affected by AI demand, while investment-management costs have risen partly because market gains lift fees tied to assets under management.Even after the revisions, core PCE would still be well above the Fed’s 2% target. But at a time when some Fed officials are debating whether higher rates may be needed, a slightly lower inflation reading could weaken the case for another hike.
Private Equity’s Liquidity Trade-Off is Becoming More Visible in Markets – Private equity’s liquidity ‘reality’ is becoming harder to ignore. According to PitchBook, the net asset value of U.S. private-equity assets stuck in funds at least 10 years old reached a record $348.5 billion at the end of 2025. That is 3.5 times the level from 2015 and more than 100 times the amount in 2005. These so-called “zombie funds” are typically no longer raising capital or buying new companies. Instead, they are holding remaining assets that managers have struggled to sell. The problem stems partly from timing. Many funds bought companies during the 2020–2021 boom, when interest rates were near zero and valuations were high. Today, higher borrowing costs have made buyers less willing to pay those peak prices.The backlog may continue to grow. Funds that are seven to nine years old now hold an estimated $512.7 billion in net asset value, more than double the 2015 level. More broadly, Preqin estimates that unsold North American private-equity portfolio companies totaled $3.91 trillion as of September 2025, representing 74% of all North American private-equity assets on balance sheets. For investors, it’s a reminder that private investments can offer access to different opportunities, but they also come with less transparency, less liquidity, and a greater reliance on managers’ ability to sell assets at attractive prices.Public markets, by contrast, offer daily liquidity and transparent pricing.4
The Hidden Risk Behind Every Investment Decision – Markets can be unpredictable, but one of the biggest challenges investors face is staying disciplined when emotions take over. Headlines, market volatility, and personal biases can all influence investment decisions in ways that aren’t always obvious.
To help you recognize these common pitfalls, I’m offering our guide, Three Steps to Overcoming Investment Behavioral Bias6. Inside, you’ll learn:
- The two main types of biases that affect investors: Cognitive and Emotional
- Specific examples of biased decision-making that can negatively impact your portfolio
- Three essential actions you can take to counteract the natural investor tendencies toward bias
- And more…
If you have $500,000 or more to invest and are ready to learn more, click on the link below to get your copy today!
Disclosure
2 Zacks Investment Management reserves the right to amend the terms or rescind the free Three Steps to Overcoming Investment Behavioral Bias offer at any time and for any reason at its discretion.
3 Wall Street Journal. July 19, 2026. https://www.wsj.com/economy/central-banking/pce-inflation-data-updates-ca7bfd61?mod=economy_lead_pos3
4 Fred Economic Data. June 25, 2026. https://fred.stlouisfed.org/series/PCEPILFE
5 Wall Street Journal. July 21, 2026. https://www.wsj.com/finance/investing/private-equity-assets-stuck-in-zombie-funds-are-at-a-record-high-4dbd01be?mod=hp_lead_pos5
6 Zacks Investment Management reserves the right to amend the terms or rescind the free Three Steps to Overcoming Investment Behavioral Bias offer at any time and for any reason at its discretion.
DISCLOSURE
Past performance is no guarantee of future results. Inherent in any investment is the potential for loss.
Zacks Investment Management, Inc. is a wholly-owned subsidiary of Zacks Investment Research. Zacks Investment Management is an independent Registered Investment Advisory firm and acts as an investment manager for individuals and institutions. Zacks Investment Research is a provider of earnings data and other financial data to institutions and to individuals.
This material is being provided for informational purposes only and nothing herein constitutes investment, legal, accounting or tax advice, or a recommendation to buy, sell or hold a security. Do not act or rely upon the information and advice given in this publication without seeking the services of competent and professional legal, tax, or accounting counsel. Publication and distribution of this article is not intended to create, and the information contained herein does not constitute, an attorney-client relationship. No recommendation or advice is being given as to whether any investment or strategy is suitable for a particular investor. It should not be assumed that any investments in securities, companies, sectors or markets identified and described were or will be profitable. All information is current as of the date of herein and is subject to change without notice. Any views or opinions expressed may not reflect those of the firm as a whole.
Any projections, targets, or estimates in this report are forward looking statements and are based on the firm’s research, analysis, and assumptions. Due to rapidly changing market conditions and the complexity of investment decisions, supplemental information and other sources may be required to make informed investment decisions based on your individual investment objectives and suitability specifications. All expressions of opinions are subject to change without notice. Clients should seek financial advice regarding the appropriateness of investing in any security or investment strategy discussed in this presentation.
Certain economic and market information contained herein has been obtained from published sources prepared by other parties. Zacks Investment Management does not assume any responsibility for the accuracy or completeness of such information. Further, no third party has assumed responsibility for independently verifying the information contained herein and accordingly no such persons make any representations with respect to the accuracy, completeness or reasonableness of the information provided herein. Unless otherwise indicated, market analysis and conclusions are based upon opinions or assumptions that Zacks Investment Management considers to be reasonable.
Any investment inherently involves a high degree of risk, beyond any specific risks discussed herein.
It is not possible to invest directly in an index. Investors pursuing a strategy similar to an index may experience higher or lower returns, which will be reduced by fees and expenses.
The ICE U.S. Dollar Index measures the value of the U.S. Dollar against a basket of currencies of the top six trading partners of the United States, as measured in 1973: the Euro zone, Japan, the United Kingdom, Canada, Sweden, and Switzerland. An investor cannot directly invest in an index. The volatility of the benchmark may be materially different from the individual performance obtained by a specific investor.
The S&P 500 Index is a well-known, unmanaged index of the prices of 500 large-company common stocks, mainly blue-chip stocks, selected by Standard & Poor’s. The S&P 500 Index assumes reinvestment of dividends but does not reflect advisory fees. The volatility of the benchmark may be materially different from the individual performance obtained by a specific investor. An investor cannot invest directly in an index.