I have been hearing a common refrain in the financial news and from readers: the financial markets are not accurately pricing the grim realities of the economic situation in the U.S. and abroad; stocks are too expensive; the election is going to throw markets into disarray; tech is overvalued! The list goes on. Many see an economy puttering forward, while the stock market signals a v-shaped recovery. The disconnect is throwing a lot of people off.
None of the above observations are market myths, but the line of reasoning that leads to these observations sometimes are. Here are four to watch for in the fourth quarter.
Market Myth #1: The Stock Market and the Economy are Too Disconnected
The key element to understand here is that the stock market is a leading indicator for the economy. Case-in-point: historically, markets reach a bottom about four months beforea recession officially ends. As I’ve written before, stocks do not tend to wait for good news.
As such, the stock market being disconnected from the economy is not necessarily an anomaly – it’s the norm. In past economic cycles, we have seen an economy beset by job losses, rising uncertainty, and relentlessly negative news coverage, all while the stock market rallies. After the 2008 Financial Crisis, it was not until late fall 2009 when improvements in the labor market became visible. By then, the bull market was already six months old.
In my view, the stock market today is arguably pricing-in what the economy will look like a year from now, and what the market sees is significant pent-up demand, a fading pandemic-induced economic impact, and a wall of liquidity coursing its way through capital markets (with maybe more on the way).
_________________________________________________________________________
Instead of Focusing on Market Myths, Focus on the Fundamentals!
With the end of the year fast-approaching and the election just around the corner, you may be tempted to base your investments less on fact and data and more on emotion. Instead of giving into this way of thinking, I recommend staying focused on the fundamentals. To help you do this, I am offering all readers our just-released Stock Market Outlook report. This report contains some of our key forecasts to consider such as:
- A look at potential Covid-19 vaccines
- What produces 2021 optimism?
- What of U.S. GDP growth?
- What should you think about Covid-19 era jobs data?
- An update on U.S. fiscal stimulus
- Zacks Rank S&P 500 sector picks
- International update on key global regions
- And much more
If you have $500,000 or more to invest and want to learn more about these forecasts, click on the link below to get your free report today!
IT’S FREE. Download the Just-Released November 2020 Stock Market Outlook3
_________________________________________________________________________
Market Myth #2: This Election Will Make or Break the Economy and Stock Market
There is little doubt that this U.S. election cycle is about as contentious as it gets. Depending on your political orientation, you may think a victory for the other side will have damaging consequences for the economy and the market. Fortunately, history does not provide the same conclusion:
S&P 500 Average Annual Performance, 1933 – 2019
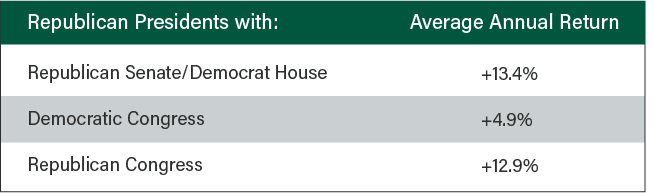
Source: Strategas Research.2 To note: the above returns exclude 2001-2002, as power in the Senate changed hands three times in that period.
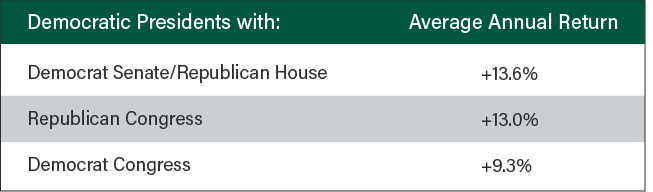
At Zacks Investment Management, we maintain a politically agnostic approach to investing. This approach is not to say that politics or policies do not matter – they do. But in our view, it makes better sense to form an investment thesis once policies are known and appear poised to be enacted into law. In other words, it’s better for investors to watch what politicians do, not what they say.
Market Myth #3: Valuations are Too High
With corporate earnings still inching back to pre-pandemic levels – but with the stock market also near all-time highs – valuations have pushed higher. In previous investment cycles, investors would have looked warily at an S&P 500 trading at over 20x forward earnings. Today, not so much. Why?
In my view, the best answer is: interest rates. Near-zero interest rates have implications for nearly all asset classes, not just bonds. If an investor can expect to earn only 1% on a 10-year U.S. Treasury, the desire for a better return is likely to nudge them further out on the risk curve – often into stocks.
Think of this another way – if the risk-free rate is 1%, investors may reasonably demand a return of 4% from stocks, factoring-in a 3% “equity risk premium.” An earnings yield of 4% on stocks implies a P/E ratio of 25, signaling investors may even by comfortable with valuations drifting higher from here.
Market Myth #4: The Technology Sector is in a Bubble Like 1999
Technology in particular has seen valuations drift materially higher, spurring concern that a bubble is forming akin to the one in 1999. There are several key differences between now and 1999, however:
- The magnitude of the late 1990’s rally was far more extreme, particularly for companies with zero or negative earnings (of which there were many).
- An equally-weighted index of Technology stocks shows them trading at 26.89x forward earnings, almost half the P/E levels experienced in 2000.
- Near-zero interest rates are pushing investors further out onto the risk curve, and technology companies offer robust earnings growth and free cash flow – even if they’re a bit expensive.
- Investors may be underappreciating the emergence of a technology “super-cycle,” where tech dominance and growing market share of the economy could continue.
To be fair, many technology stocks are quite expensive and trade at exorbitant prices relative to earnings and free cash flow. But not all of them do, and investors should take care and perform due diligence when establishing your portfolio exposure to the sector.
Bottom Line for Investors
As we approach the election and the end of the year, investors may be lured increasingly into lines of reasoning that are based less on fact and more on emotion. Some of these lines of reasoning may be market myths, and investors should try to avoid the ‘traps.’ When the investment and/or political and social environment feel uncertain, it is important to redouble your efforts to make investment decisions based on fundamentals and what we know about equity markets from history. Doing so usually results in taking a steady, patient, long-term-oriented approach, which is where a majority of investors need to land.
To help you base your investment decisions on fundamentals and hard data, I am offering all readers our Just-Released November 2020 Stock Market Outlook Report.
This report looks at several factors that are producing optimism right now and contains some of our key forecasts to consider such as:
- A look at potential Covid-19 vaccines
- What produces 2021 optimism?
- What of U.S. GDP growth?
- What should you think about Covid-19 era jobs data?
- An update on U.S. fiscal stimulus
- Zacks Rank S&P 500 sector picks
- International update on key global regions
- And much more
If you have $500,000 or more to invest and want to learn more about these forecasts, click on the link below to get your free report today!
Disclosure
2 Strategas, Quarterly Review in Charts, October 2, 2020.
3 Strategas, Quarterly Review in Charts, October 2, 2020.
4 Zacks Investment Management reserves the right to amend the terms or rescind the free Stock Market Outlook offer at any time and for any reason at its discretion.
DISCLOSURE
Past performance is no guarantee of future results. Inherent in any investment is the potential for loss.
Zacks Investment Management, Inc. is a wholly-owned subsidiary of Zacks Investment Research. Zacks Investment Management is an independent Registered Investment Advisory firm and acts as an investment manager for individuals and institutions. Zacks Investment Research is a provider of earnings data and other financial data to institutions and to individuals.
This material is being provided for informational purposes only and nothing herein constitutes investment, legal, accounting or tax advice, or a recommendation to buy, sell or hold a security. Do not act or rely upon the information and advice given in this publication without seeking the services of competent and professional legal, tax, or accounting counsel. Publication and distribution of this article is not intended to create, and the information contained herein does not constitute, an attorney-client relationship. No recommendation or advice is being given as to whether any investment or strategy is suitable for a particular investor. It should not be assumed that any investments in securities, companies, sectors or markets identified and described were or will be profitable. All information is current as of the date of herein and is subject to change without notice. Any views or opinions expressed may not reflect those of the firm as a whole.
Any projections, targets, or estimates in this report are forward looking statements and are based on the firm’s research, analysis, and assumptions. Due to rapidly changing market conditions and the complexity of investment decisions, supplemental information and other sources may be required to make informed investment decisions based on your individual investment objectives and suitability specifications. All expressions of opinions are subject to change without notice. Clients should seek financial advice regarding the appropriateness of investing in any security or investment strategy discussed in this presentation.
Certain economic and market information contained herein has been obtained from published sources prepared by other parties. Zacks Investment Management does not assume any responsibility for the accuracy or completeness of such information. Further, no third party has assumed responsibility for independently verifying the information contained herein and accordingly no such persons make any representations with respect to the accuracy, completeness or reasonableness of the information provided herein. Unless otherwise indicated, market analysis and conclusions are based upon opinions or assumptions that Zacks Investment Management considers to be reasonable. Any investment inherently involves a high degree of risk, beyond any specific risks discussed herein.
The S&P 500 Index is a well-known, unmanaged index of the prices of 500 large-company common stocks, mainly blue-chip stocks, selected by Standard & Poor’s. The S&P 500 Index assumes reinvestment of dividends but does not reflect advisory fees. The volatility of the benchmark may be materially different from the individual performance obtained by a specific investor. An investor cannot invest directly in an index.
The Russell 1000 Growth Index is a well-known, unmanaged index of the prices of 1000 large-company growth common stocks selected by Russell. The Russell 1000 Growth Index assumes reinvestment of dividends but does not reflect advisory fees. An investor cannot invest directly in an index. The volatility of the benchmark may be materially different from the individual performance obtained by a specific investor.
Nasdaq Composite Index is the market capitalization-weighted index of over 3,300 common equities listed on the Nasdaq stock exchange. The types of securities in the index include American depositary receipts, common stocks, real estate investment trusts (REITs) and tracking stocks, as well as limited partnership interests. The index includes all Nasdaq-listed stocks that are not derivatives, preferred shares, funds, exchange-traded funds (ETFs) or debenture securities. An investor cannot invest directly in an index. The volatility of the benchmark may be materially different from the individual performance obtained by a specific investor.