Broad equity markets have rebounded strongly from last year’s pandemic-induced recession, but they’re not the only asset class seeing strong gains.1
Commodities are on the upswing, too.
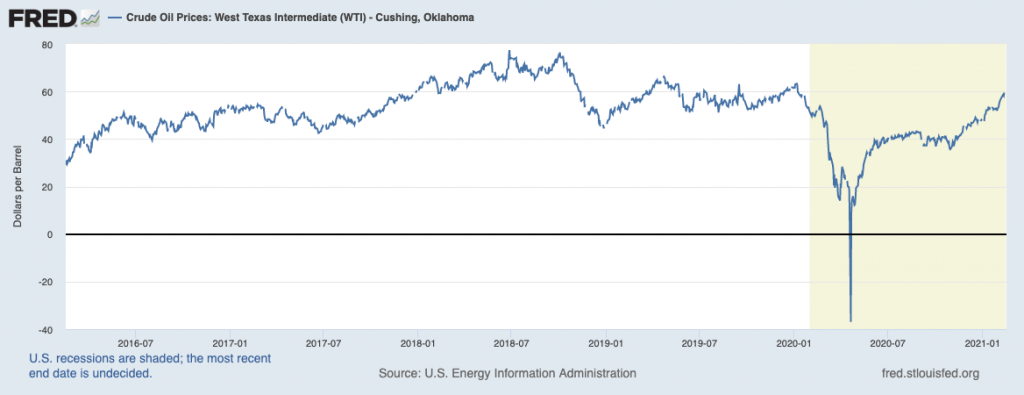
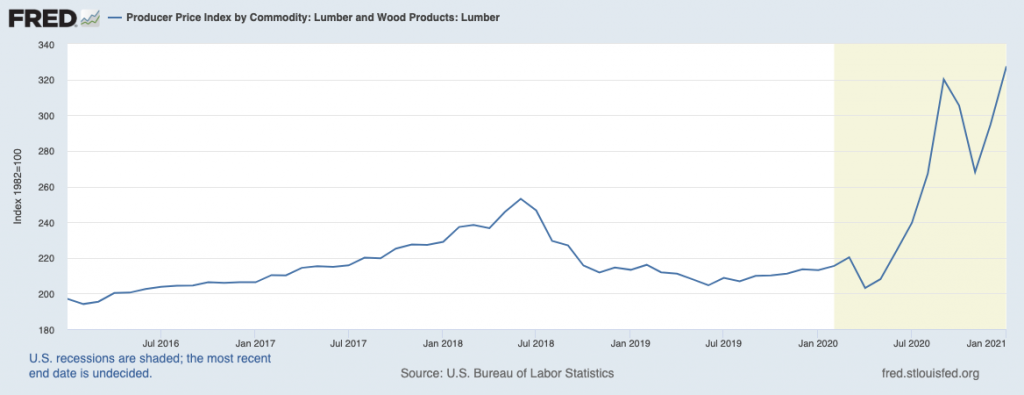
As of last week, the Bloomberg Commodity Spot Index was up over 60% from the pandemic lows touched last March, and even still, many individual commodities have not climbed back up to pre-pandemic prices.2 As you can see in the series of charts below, everything from copper, to oil, to lumber is seeing upward price pressure:
Crude Oil Prices: West Texas Intermediate (5 Years)
__________________________________________________________________________
Instead of Timing the Market, Focus on These Key Data Points
Looking at the performance in the equity markets pre-pandemic versus right now is proof that it is impossible to time the market. Commodities are seeing upward prices now, but how long will this last?
It’s good to stay on top of the market, but not by making short-term, emotional decisions. Instead, I recommend that you maintain a diversified portfolio and focus on key data points that can positively impact your long-term investments.
To help you do this, I am offering all readers our just-released Stock Market Outlook report. This report contains some of our key forecasts to consider such as:
- S&P 500 earnings growth
- Outlook for underlying U.S. economy?
- U.S. returns expectations for 2021
- What produces 2021 optimism?
- Is it time to buy U.S. stocks?
- Update on U.S. fiscal stimulus
- And much more…
If you have $500,000 or more to invest and want to learn more about these forecasts, click on the link below to get your free report today!
IT’S FREE. Download the Just-Released March 2021 Stock Market Outlook4
__________________________________________________________________________
Metals: Producer Price Index (5 Years)

Lumber: Producer Price Index (5 Years)
Copper Prices (1990 – Present)

Explanations for why commodities are seeing upward price pressures are many. They range from increased demand coming off pandemic lows to the impact of extraordinary fiscal and monetary stimulus, to surging demand for lithium and copper needed for electricity and electric vehicles, to governments posturing for big infrastructure spending plans, to the global economy at the cusp of another commodity supercycle. I have noticed the appearance of ‘commodity supercycle’ quite a bit of late, which makes me think people may be over-committing (and getting too optimistic) to the possibility.
The reality of commodity price pressures could be because of none of the above factors, or all of the above factors. My point is this: investors should avoid trying to forecast commodity cycles and prices too far into the future. I agree the 2021 outlook for commodities, and by extension Materials and Industrials companies, is positive. But I don’t think it makes sense to forecast too much further than that.
Most economists and market historians would agree that there have been four commodity supercycles in history, with the last one starting around the mid-1990s. Many readers may remember the powerful rise of Emerging Markets and in particular, China, in the 2000s. Historic infrastructure build-outs across the developing world – and a weak U.S. dollar – helped drive a significant portion of that supercycle, which peaked in 2008 and arguably ended sometime in the last decade (still being determined).
We know the 2008 Global Financial Crisis gave way to middling global economic growth, and it also hurt the Emerging Market’s ability to access debt markets. Commodities suffered during this period, and more recently, trade wars and the global economic shutdown tied to the pandemic made it worse. Supercycle advocates argue these events created a new bottom for commodities.
Time will tell. In the meantime, for investors, I would argue it is not essential to know today whether we are entering a commodities supercycle or not. Why try to make forecasts several years into the future, on fairly limited information?
I would agree the massive liquidity event caused by the pandemic – coupled with a likely resurgence of economic activity following a once-in-a-generation pandemic – should drive demand nicely higher in the next year. This should benefit commodities and the Energy sector in general, and I think it makes sense to maintain portfolio exposure in these areas in 2021. Beyond that, you’ll have to ask me again this time next year.
Bottom Line for Investors
Perhaps one of the more important takeaways from rising commodity prices is a broader takeaway regarding inflation. I have written recently about inflation as a consideration in 2021, and what it could mean for interest rates and high valuation stocks. Recently, we’ve seen Wal-Mart announce a boost to $15/hour minimum wage, lumber prices (as detailed above) rising as demand for homebuilding goes up, and rising consumer demand squeezing factories. If anything, rising commodity prices are just another indicator pointing to inflationary pressures growing in the U.S. and global economy.
Commodity prices are rising, but no one knows what the outcome will be a few months or years. The key is not to time the market or emotionally invest in it, but to focus on key data points and economic indicators that could impact your investments in the long-term. To help you do this, I am offering all readers our Just-Released March 2021 Stock Market Outlook Report.
This report looks at several factors that are producing optimism right now and contains some of our key forecasts to consider such as:
- S&P 500 earnings growth
- Outlook for underlying U.S. economy?
- U.S. returns expectations for 2021
- What produces 2021 optimism?
- Is it time to buy U.S. stocks?
- Update on U.S. fiscal stimulus
- And much more…
If you have $500,000 or more to invest and want to learn more about these forecasts, click on the link below to get your free report today!
Disclosure
2 Bloomberg News Story. February 10, 2021. https://documentcloud.adobe.com/link/track?uri=urn:aaid:scds:US:51d4173e-2aa6-4c79-9efe-cc5d2493be70#pageNum=1
3 Fred Economic Data. February 13, 2021. https://fred.stlouisfed.org/series/DCOILWTICO
4 Zacks Investment Management reserves the right to amend the terms or rescind the free Stock Market Outlook offer at any time and for any reason at its discretion.
5 Fred Economic Data. February 17, 2021. https://fred.stlouisfed.org/series/WPU10
6 Fred Economic Data. February 17, 2021. https://fred.stlouisfed.org/series/WPS081
7 Fred Economic Data. February 8, 2021. https://fred.stlouisfed.org/series/PCOPPUSDM
8 Zacks Investment Management reserves the right to amend the terms or rescind the free Stock Market Outlook offer at any time and for any reason at its discretion.
DISCLOSURE
Past performance is no guarantee of future results. Inherent in any investment is the potential for loss.
Zacks Investment Management, Inc. is a wholly-owned subsidiary of Zacks Investment Research. Zacks Investment Management is an independent Registered Investment Advisory firm and acts as an investment manager for individuals and institutions. Zacks Investment Research is a provider of earnings data and other financial data to institutions and to individuals.
This material is being provided for informational purposes only and nothing herein constitutes investment, legal, accounting or tax advice, or a recommendation to buy, sell or hold a security. Do not act or rely upon the information and advice given in this publication without seeking the services of competent and professional legal, tax, or accounting counsel. Publication and distribution of this article is not intended to create, and the information contained herein does not constitute, an attorney-client relationship. No recommendation or advice is being given as to whether any investment or strategy is suitable for a particular investor. It should not be assumed that any investments in securities, companies, sectors or markets identified and described were or will be profitable. All information is current as of the date of herein and is subject to change without notice. Any views or opinions expressed may not reflect those of the firm as a whole.
Any projections, targets, or estimates in this report are forward looking statements and are based on the firm’s research, analysis, and assumptions. Due to rapidly changing market conditions and the complexity of investment decisions, supplemental information and other sources may be required to make informed investment decisions based on your individual investment objectives and suitability specifications. All expressions of opinions are subject to change without notice. Clients should seek financial advice regarding the appropriateness of investing in any security or investment strategy discussed in this presentation.
Certain economic and market information contained herein has been obtained from published sources prepared by other parties. Zacks Investment Management does not assume any responsibility for the accuracy or completeness of such information. Further, no third party has assumed responsibility for independently verifying the information contained herein and accordingly no such persons make any representations with respect to the accuracy, completeness or reasonableness of the information provided herein. Unless otherwise indicated, market analysis and conclusions are based upon opinions or assumptions that Zacks Investment Management considers to be reasonable. Any investment inherently involves a high degree of risk, beyond any specific risks discussed herein.
The S&P 500 Index is a well-known, unmanaged index of the prices of 500 large-company common stocks, mainly blue-chip stocks, selected by Standard & Poor’s. The S&P 500 Index assumes reinvestment of dividends but does not reflect advisory fees. The volatility of the benchmark may be materially different from the individual performance obtained by a specific investor. An investor cannot invest directly in an index.
The Russell 1000 Growth Index is a well-known, unmanaged index of the prices of 1000 large-company growth common stocks selected by Russell. The Russell 1000 Growth Index assumes reinvestment of dividends but does not reflect advisory fees. An investor cannot invest directly in an index. The volatility of the benchmark may be materially different from the individual performance obtained by a specific investor.
Nasdaq Composite Index is the market capitalization-weighted index of over 3,300 common equities listed on the Nasdaq stock exchange. The types of securities in the index include American depositary receipts, common stocks, real estate investment trusts (REITs) and tracking stocks, as well as limited partnership interests. The index includes all Nasdaq-listed stocks that are not derivatives, preferred shares, funds, exchange-traded funds (ETFs) or debenture securities. An investor cannot invest directly in an index. The volatility of the benchmark may be materially different from the individual performance obtained by a specific investor.
The Dow Jones Industrial Average measures the daily stock market movements of 30 U.S. publicly-traded companies listed on the NASDAQ or the New York Stock Exchange (NYSE). The 30 publicly-owned companies are considered leaders in the United States economy. An investor cannot directly invest in an index. The volatility of the benchmark may be materially different from the individual performance obtained by a specific investor.
Returns for each strategy and the corresponding Morningstar Universe reflect the annualized returns for the periods indicated. The Morningstar Universes used for comparative analysis are constructed by Morningstar (median performance) and data is provided to Zacks by Zephyr Style Advisor. The percentile ranking for each Zacks Strategy is based on the gross comparison for Zacks Strategies vs. the indicated universe rounded up to the nearest whole percentile. Other managers included in universe by Morningstar may exhibit style drift when compared to Zacks Investment Management portfolio. Neither Zacks Investment Management nor Zacks Investment Research has any affiliation with Morningstar. Neither Zacks Investment Management nor Zacks Investment Research had any influence of the process Morningstar used to determine this ranking.
The Russell 1000 Value Index is a well-known, unmanaged index of the prices of 1000 large-company value common stocks selected by Russell. The Russell 1000 Value Index assumes reinvestment of dividends but does not reflect advisory fees. An investor cannot directly invest in an index. The volatility of the benchmark may be materially different from the individual performance obtained by a specific investor.