U.S. stocks as measured by the S&P 500 finished the first quarter in slightly negative territory, having posted a fairly strong rally since early March. For the tech-heavy Nasdaq and the small-cap Russell 2000, however, the first quarter posted much steeper declines, as ‘risk-off’ sentiment seemed to disproportionately impact the higher risk, higher valuation areas of the market.
Even though stocks generally held up in the back half of March, I think it’s too early to declare the stock market correction over. I could see volatility persisting for weeks or even months from here – an outcome that would be normal, in my view, not worrisome. Short-term volatility is the price equity investors pay for attractive long-term returns. It comes with the territory. Going back to 1928, the average peak-to-trough pullback in a given year was -16.3%, and from 1928 to 2021, stocks fell at least -10% in 63% of the years. Corrections are common.1
Don’t Let Your Investments Fall Off Track During a Market Correction!
As a result of the market correction and increased volatility, you may feel the urge to make drastic moves, but do not fall prey to this mistake. Instead, remember to think long-term.
To help you do this, I am offering all readers an exclusive look into our just-released March 2022 Stock Market Outlook report.
You’ll discover Zacks’ view on:
- U.S. Macro Outlook
- What’s alive for 2022 pessimists?
- Is it time to buy U.S stocks?
- Zacks forecasts
- What fundamentals are U.S. stock markets pricing in for 2022?
- And much more
If you have $500,000 or more to invest and want to learn more about these forecasts, click on the link below to get your free guide.
Free Download – March 2022 Stock Market Outlook Report!2
Last year, the biggest pullback we saw on the S&P 500 was just -5.2%. Thinking in a historical context, if 2022 delivered one or two 10+% corrections throughout the year, investors should see that outcome as pretty normal – even though the factors driving sentiment lower feel ‘different’ and significant (inflation, Fed rate hikes, ongoing pandemic, and war in Ukraine).
Every market correction and volatile patch has a story tied to it, and it can be challenging for investors to accept that the market can do well even when there is war and soaring energy prices, for example. But stocks respond to earnings and shift earnings expectations over time, and right now we still see another year where S&P 500 companies are poised to deliver profit expansion. In the past month, profit estimates for S&P 500 companies went up, not down, even as the war escalated and crude oil prices soared.
The earnings outlook is one of the main reasons I think investors should remain patient even if the stock market re-enters correction territory from here. But there is also some pretty clear history around how the stock market performs once a correction has run its course. Since 1974, the S&P 500 has gone up an average of 8+% in the month following a correction’s bottom, and has risen an average of +24% one year later. A person can only participate in these rallies if they are fully invested at the bottom which almost by definition means participating in the downside volatility leading up to it.
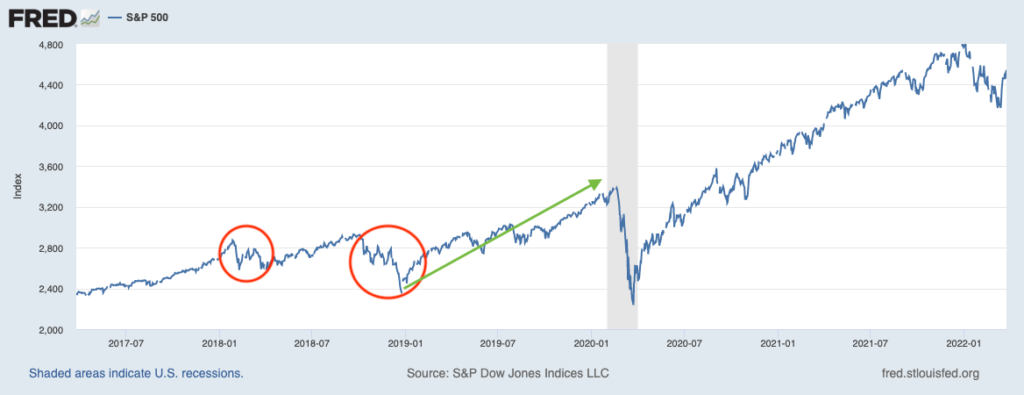
2018 offers a useful example from recent history to demonstrate how corrections can persist and be a little sticky in a given year. Investors may remember 2018 was a year characterized by Fed rate hikes and the U.S. – China trade war. That year, the S&P 500 endured a Q1 correction of over -10%, then rebounded nicely into Q4 only to fall back into a correction by year-end. The S&P 500 finished the year down -4.4%.
In Q1 2019, however, stocks rebounded by more than +13%, and continued on a course throughout that year to finish up +31.5%. Strong returns often follow periods of downside volatility.
Bottom Line for Investors
No one truly knows whether the market volatility and/or the stock market correction has run its course – or whether there could be more turbulence ahead. I realize this is probably not a satisfying takeaway for many investors, especially given all of the uncertainty surrounding the ongoing war in Ukraine and rising energy prices. But I think investors can – and should – take solace in remembering that market volatility and corrections are not only common, but they’re also healthy. Markets need to reset valuations and investors’ expectations from time to time.
The war continues to be disheartening and disconcerting, but for now, it appears the conflict will remain regional – not global. The impact on the oil markets also appears to be better understood by markets and corporations, which may help explain some of the rallies we’ve seen in stocks since March. We will continue to monitor the situation closely and will offer updates if our views change.
In the meantime, I recommend that you keep a close eye on risks and other economic indicators to protect your investments. To help, I am offering all readers an exclusive look at our just-released March 2022 Stock Market Outlook Reporthttps://go.steadyinvestor.com/arrow-stock-market-outlook?source=website&medium=blog&term=motm_blog_2022_04_04&content=stock_market_outlook_report.
You’ll discover Zacks’ view on:
- U.S. Macro Outlook – San Fransico Fed “Fed Views”
- What’s alive for 2022 pessimists?
- Is it time to buy U.S stocks?
- Zacks market forecasts for 2022
- What fundamentals are U.S. stock markets pricing in for 2022?
- And much more
If you have $500,000 or more to invest and want to learn more about these forecasts, click on the link below to get your free guide.
Disclosure
2 Zacks Investment Management reserves the right to amend the terms or rescind the free Stock Market Outlook offer at any time and for any reason at its discretion.
3 Fred Economic Data. March 28, 2022. https://fred.stlouisfed.org/series/SP500
4 Zacks Investment Management reserves the right to amend the terms or rescind the free Stock Market Outlook offer at any time and for any reason at its discretion.
DISCLOSURE
Past performance is no guarantee of future results. Inherent in any investment is the potential for loss.
Zacks Investment Management, Inc. is a wholly-owned subsidiary of Zacks Investment Research. Zacks Investment Management is an independent Registered Investment Advisory firm and acts as an investment manager for individuals and institutions. Zacks Investment Research is a provider of earnings data and other financial data to institutions and to individuals.
This material is being provided for informational purposes only and nothing herein constitutes investment, legal, accounting or tax advice, or a recommendation to buy, sell or hold a security. Do not act or rely upon the information and advice given in this publication without seeking the services of competent and professional legal, tax, or accounting counsel. Publication and distribution of this article is not intended to create, and the information contained herein does not constitute, an attorney-client relationship. No recommendation or advice is being given as to whether any investment or strategy is suitable for a particular investor. It should not be assumed that any investments in securities, companies, sectors or markets identified and described were or will be profitable. All information is current as of the date of herein and is subject to change without notice. Any views or opinions expressed may not reflect those of the firm as a whole.
Any projections, targets, or estimates in this report are forward looking statements and are based on the firm’s research, analysis, and assumptions. Due to rapidly changing market conditions and the complexity of investment decisions, supplemental information and other sources may be required to make informed investment decisions based on your individual investment objectives and suitability specifications. All expressions of opinions are subject to change without notice. Clients should seek financial advice regarding the appropriateness of investing in any security or investment strategy discussed in this presentation.
Certain economic and market information contained herein has been obtained from published sources prepared by other parties. Zacks Investment Management does not assume any responsibility for the accuracy or completeness of such information. Further, no third party has assumed responsibility for independently verifying the information contained herein and accordingly no such persons make any representations with respect to the accuracy, completeness or reasonableness of the information provided herein. Unless otherwise indicated, market analysis and conclusions are based upon opinions or assumptions that Zacks Investment Management considers to be reasonable. Any investment inherently involves a high degree of risk, beyond any specific risks discussed herein.
The S&P 500 Index is a well-known, unmanaged index of the prices of 500 large-company common stocks, mainly blue-chip stocks, selected by Standard & Poor’s. The S&P 500 Index assumes reinvestment of dividends but does not reflect advisory fees. The volatility of the benchmark may be materially different from the individual performance obtained by a specific investor. An investor cannot invest directly in an index.
The Russell 1000 Growth Index is a well-known, unmanaged index of the prices of 1000 large-company growth common stocks selected by Russell. The Russell 1000 Growth Index assumes reinvestment of dividends but does not reflect advisory fees. An investor cannot invest directly in an index. The volatility of the benchmark may be materially different from the individual performance obtained by a specific investor.
Nasdaq Composite Index is the market capitalization-weighted index of over 3,300 common equities listed on the Nasdaq stock exchange. The types of securities in the index include American depositary receipts, common stocks, real estate investment trusts (REITs) and tracking stocks, as well as limited partnership interests. The index includes all Nasdaq-listed stocks that are not derivatives, preferred shares, funds, exchange-traded funds (ETFs) or debenture securities. An investor cannot invest directly in an index. The volatility of the benchmark may be materially different from the individual performance obtained by a specific investor.
The Dow Jones Industrial Average measures the daily stock market movements of 30 U.S. publicly-traded companies listed on the NASDAQ or the New York Stock Exchange (NYSE). The 30 publicly-owned companies are considered leaders in the United States economy. An investor cannot directly invest in an index. The volatility of the benchmark may be materially different from the individual performance obtained by a specific investor.