Kevin R. from Fairfield, CA asks: Hi Mitch, I’m concerned about the October inflation numbers and the pattern of higher prices. The “temporary” inflation argument looks like it’s wrong, and I’m wondering if we should be more worried about this. Thank you.
Mitch’s Response:
Thanks for writing, Kevin. I know your concern is shared among many readers, and it’s probably the most-discussed worry in the financial media – all of which makes me bullish, as I will explain later.
First, let’s frame the inflation issue. In October, the Consumer Price Index (CPI) measure of inflation reached a 30-year high, posting a 6.2% year-over-year increase and following five straight months where inflation has topped 5%.1
An equally important, but far less acknowledged, gauge of inflation is producer prices, as measured by the producer-price index (PPI). A good way to understand the PPI is in relation to the CPI. The CPI measures the change in prices from the consumer’s point of view, while the PPI measures the change in prices from the business’s point of view. In a sign inflation is currently broad-based, the U.S. PPI also soared in October, recording its biggest increase on record at 8.6%.
_____________________________________________________________________________
Managing Your Investments Through Inflation
When investors are faced with inflation and volatility, they tend to chase negative headlines. Questions may arise like: Could volatility actually be an opportunity? What’s the next step?
The real challenge is not in finding a way to eliminate volatility—it is developing a mental approach to dealing with it. Our guide, “Helping You Manage Market Volatility,” will provide you with insights and tips to do just that. Get answers to questions like:
- Market downturns can and will occur, but what should you do?
- How can diversification help you manage volatility without compromising your returns?
- When volatility is too much for you to handle, how can a money manager help?
- Can volatility be an opportunity?
If you have $500,000 or more to invest and want to get answers to the questions above, click on the link below to download this guide today!
Download Zacks Volatility Guide, “Helping You Manage Market Volatility.”2
_____________________________________________________________________________
Even if we say these inflation readings are high because of the base rate effects, i.e., comparing them to much lower 2020 inflation levels, the month-over-month price increases have also been pretty firm this year. Earlier in the year, we saw month-over-month inflation spikes due to base effects of rising hotel prices, airline tickets, and used cars, and later in the year (currently), the increases have been tied to labor shortages, rising energy prices, and snags in the global supply chain.
Permanent, nefarious inflation happens when there is too much money chasing too few goods, which I’m sure has many readers saying: that’s what we have now! The difference, however, is that the U.S. and global economy have the capacity to build-out supply, it is just currently trailing the demand surge in the economy. In other words, turning consumer demand ‘back on’ can happen instantaneously. Turning supply back on takes a bit more time, as businesses ramp up production and push towards being fully back online. “Too few goods” is fixable, in other words, and I think it will be fixed in a few months’ time.
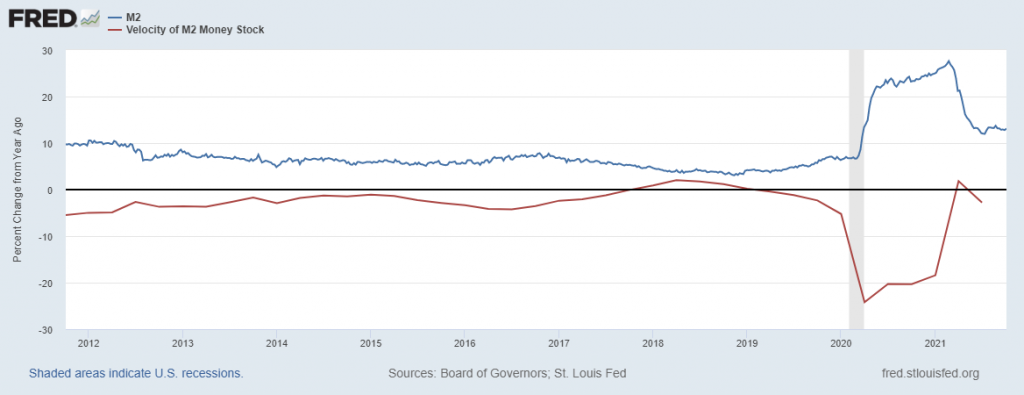
On the “too much money” side, while it is true that government stimulus created a sizable increase in the M2 money stock, we have not seen a sustained increase in the velocity of M2, which ultimately measures whether the money is transacting in the economy (loans, spending, etc.). We know a good portion of stimulus money was used to pay down debt and to save, and bank lending has not moved considerably higher over the past year. As you can see in the chart below, the “too much money” side of the equation is moderating.
Finally, as I alluded to at the outset of my response, the widespread concern and worry makes me even more bullish. The reason is simple: When everyone is fixated on an issue and it becomes widely discussed, its pricing power concurrently falls. This is how “walls of worry” get built. In other words, while we grow increasingly concerned about inflation, the market has already priced in its actual impact.
Let us help you steer through volatility and inflation instead of worrying about what’s coming next. Our guide, Helping You Manage Market Volatility3, will provide you with insights and tips to do just that. Get answers to questions like:
- Market downturns can and will occur, but what should you do?
- How can diversification help you manage volatility without compromising your returns?
- When volatility is too much for you to handle, how can a money manager help?
- Can volatility actually be an opportunity?
If you have $500,000 or more to invest and want to get answers to the questions above, click on the link below to download this guide today!
Disclosure
2 ZIM may amend or rescind the guide “Helping You Manage Market Volatility” for any reason and at ZIM’s discretion.
3 Fred Economic Data. October 26, 2021. https://fred.stlouisfed.org/series/WM2NS#0
4 ZIM may amend or rescind the guide “Helping You Manage Market Volatility” for any reason and at ZIM’s discretion.
DISCLOSURE
Past performance is no guarantee of future results. Inherent in any investment is the potential for loss.
Zacks Investment Management, Inc. is a wholly-owned subsidiary of Zacks Investment Research. Zacks Investment Management is an independent Registered Investment Advisory firm and acts as an investment manager for individuals and institutions. Zacks Investment Research is a provider of earnings data and other financial data to institutions and to individuals.
This material is being provided for informational purposes only and nothing herein constitutes investment, legal, accounting or tax advice, or a recommendation to buy, sell or hold a security. Do not act or rely upon the information and advice given in this publication without seeking the services of competent and professional legal, tax, or accounting counsel. Publication and distribution of this article is not intended to create, and the information contained herein does not constitute, an attorney-client relationship. No recommendation or advice is being given as to whether any investment or strategy is suitable for a particular investor. It should not be assumed that any investments in securities, companies, sectors or markets identified and described were or will be profitable. All information is current as of the date of herein and is subject to change without notice. Any views or opinions expressed may not reflect those of the firm as a whole.
Any projections, targets, or estimates in this report are forward looking statements and are based on the firm’s research, analysis, and assumptions. Due to rapidly changing market conditions and the complexity of investment decisions, supplemental information and other sources may be required to make informed investment decisions based on your individual investment objectives and suitability specifications. All expressions of opinions are subject to change without notice. Clients should seek financial advice regarding the appropriateness of investing in any security or investment strategy discussed in this presentation.
Certain economic and market information contained herein has been obtained from published sources prepared by other parties. Zacks Investment Management does not assume any responsibility for the accuracy or completeness of such information. Further, no third party has assumed responsibility for independently verifying the information contained herein and accordingly no such persons make any representations with respect to the accuracy, completeness or reasonableness of the information provided herein. Unless otherwise indicated, market analysis and conclusions are based upon opinions or assumptions that Zacks Investment Management considers to be reasonable. Any investment inherently involves a high degree of risk, beyond any specific risks discussed herein.
The S&P 500 Index is a well-known, unmanaged index of the prices of 500 large-company common stocks, mainly blue-chip stocks, selected by Standard & Poor’s. The S&P 500 Index assumes reinvestment of dividends but does not reflect advisory fees. The volatility of the benchmark may be materially different from the individual performance obtained by a specific investor. An investor cannot invest directly in an index.
The MSCI ACWI Value Index captures large and mid-cap securities exhibiting overall value style characteristics across 23 Developed Markets countries and 27 Emerging Markets (EM) countries. The value investment style characteristics for index construction are defined using three variables: book value to price, 12-month forward earnings to price and dividend yield. An investor cannot invest directly in an Index. The volatility of the benchmark may be materially different from the individual performance obtained by a specific investor.