In today’s Steady Investor, we look at key factors that we believe are currently impacting market recovery and what could be next for the markets such as:
- Global manufacturing shows signs of improvement
- Retail investors should move with caution when trading stocks
- U.S. debt has reached its highest level since World War II
Factories Show Signs of Improvement, But Will It Persist? Factory activity in August showed improvement across the world, with the U.S., Asia, and Europe all broadly expanding. China recorded sizable gains for new orders, production, and exports, while the U. K’s factory output expanded at its fastest pace in six years. Italy and Germany followed suit with their best expansionary readings in two years. Here in the U.S., the Institute for Supply Management (ISM) reported that factory output in August expanded at its fastest pace since November 2018.1 Taken together, this data paints a picture of a global manufacturing sector in recovery mode, but there’s a caveat – manufacturing firms continue to shed jobs even as production rebounds. This trend may be part of a larger move amongst firms to trim workforce and streamline operations, but it may also imply a short-lived rebound. Lagging employment growth could place a cap on productivity gains going forward.
__________________________________________________________________________
Inside the Debate Surrounding U.S and Global Economic Recovery
High-frequency data has become a go-to in the Covid-19 era. Economists and analysts alike are relying on very short-term data like weekly employment reports, job postings, retail foot traffic, restaurant reservations, and so on to gain a better understanding of how the economic recovery is taking shape – or isn’t taking shape.
To help you make sense of this data, we have developed our just-released Market Strategy Report, which looks at some of the high frequency data points offering insight into the recovery.
Get a deeper look into this data and what it could mean for economic recovery with our report. If you have $500,000 or more to invest and want to learn more, click on the link below to get your free report today!
Download Our Just-Released August Market Strategy Report2
__________________________________________________________________________
Caution: Retail Investors are Trading More Stocks – With ‘free’ trading apps like Robinhood gaining in popularity, and with major brokerage houses ditching commission-based trades, many individual investors are back at the trading desk (home) buying and selling stocks. Individual stock trading is at a 10-year high – in the first six months of 2020, retail investor trading accounted for almost 20% of all shares traded in the U.S. stock market, which is double the level recorded in 2010.3 Many retail investors are returning to the day trading world because they’re stuck at home and looking for productive ways to earn returns. But in our view, this trend does not end well. Many retail investors are attracted in the current environment to high flying names in technology and pharmaceuticals, using technical indicators to trade in and out of stocks quickly. We think this makes investors vulnerable to losing more often than winning.
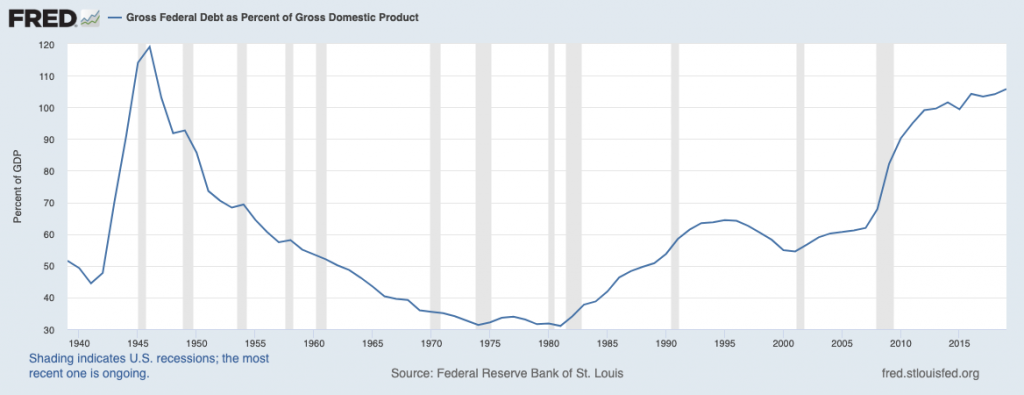
U.S. Debt Expected to Exceed 100% of GDP – The Covid-19 pandemic necessitated some drastic measures on the government level to stem the economic crisis. The CARES Act tab amounted to roughly $2 trillion, and follow-on spending packages have added at least a trillion dollars more. Meanwhile, government tax revenues are down given the recent tax cuts, a deep recession, and the new unemployment situation in the U.S. The end result: U.S. debt has reached its highest level (relative to GDP) since World War II, and is only expected to climb higher from here. By next year, it is estimated that U.S. debt to GDP could climb higher than WWII levels, which would put the U.S. in the same company as Japan, Italy, and Greece. Even still, global investors continue to buy U.S. Treasuries at a strong clip, signaling that U.S. debt is still viewed as among the safest in the world.4 With interest rates almost sure to remain low in the quarters and years to come, the United States arguably has plenty more room to borrow.
What Does High Frequency Data Say About Economic Recovery? Debate over the pace and breadth of the U.S. and global economy continues. Whether it’s a v-shaped, w-shaped, Nike swoosh shape, or the new “K-shaped” recovery being predicted, economists appear to be all over the map. But the wide disparities in forecasting have brought to light a new way of collecting information to meet the moment: the use of high-frequency data.
Economists and analysts alike are relying on very short-term data like weekly employment reports, job postings, retail foot traffic, restaurant reservations, and so on to gain a better understanding of how the economic recovery is taking shape – or isn’t taking shape.
To help you make sense of this data, we have developed our just-released Market Strategy Report,6 which looks at some of the high frequency data points offering insight into the recovery.
Get a deeper look into this data and what it could mean for economic recovery with our report. If you have $500,000 or more to invest and want to learn more, click on the link below to get your free report today!
Disclosure
2 Zacks Investment Management reserves the right to amend the terms or rescind the free Market Strategy Report offer at any time and for any reason at its discretion.
3 The Wall Street Journal, April 29, 2020. https://www.wsj.com/articles/coronavirus-turmoil-free-trades-draw-newbies-into-stock-market-11588158001?mod=djemMoneyBeat_us
4 The Wall Street Journal, September 2, 2020. https://www.wsj.com/articles/u-s-debt-is-set-to-exceed-size-of-the-economy-for-year-a-first-since-world-war-ii-11599051137
5 Federal Reserve Bank of St. Louis and U.S. Office of Management and Budget, Gross Federal Debt as Percent of Gross Domestic Product [GFDGDPA188S], retrieved from FRED, Federal Reserve Bank of St. Louis; https://fred.stlouisfed.org/series/GFDGDPA188S, September 2, 2020.
6 Zacks Investment Management reserves the right to amend the terms or rescind the free Market Strategy Report offer at any time and for any reason at its discretion.
DISCLOSURE
Past performance is no guarantee of future results. Inherent in any investment is the potential for loss.
Zacks Investment Management, Inc. is a wholly-owned subsidiary of Zacks Investment Research. Zacks Investment Management is an independent Registered Investment Advisory firm and acts as an investment manager for individuals and institutions. Zacks Investment Research is a provider of earnings data and other financial data to institutions and to individuals.
This material is being provided for informational purposes only and nothing herein constitutes investment, legal, accounting or tax advice, or a recommendation to buy, sell or hold a security. Do not act or rely upon the information and advice given in this publication without seeking the services of competent and professional legal, tax, or accounting counsel. Publication and distribution of this article is not intended to create, and the information contained herein does not constitute, an attorney-client relationship. No recommendation or advice is being given as to whether any investment or strategy is suitable for a particular investor. It should not be assumed that any investments in securities, companies, sectors or markets identified and described were or will be profitable. All information is current as of the date of herein and is subject to change without notice. Any views or opinions expressed may not reflect those of the firm as a whole.
Any projections, targets, or estimates in this report are forward looking statements and are based on the firm’s research, analysis, and assumptions. Due to rapidly changing market conditions and the complexity of investment decisions, supplemental information and other sources may be required to make informed investment decisions based on your individual investment objectives and suitability specifications. All expressions of opinions are subject to change without notice. Clients should seek financial advice regarding the appropriateness of investing in any security or investment strategy discussed in this presentation.
Certain economic and market information contained herein has been obtained from published sources prepared by other parties. Zacks Investment Management does not assume any responsibility for the accuracy or completeness of such information. Further, no third party has assumed responsibility for independently verifying the information contained herein and accordingly no such persons make any representations with respect to the accuracy, completeness or reasonableness of the information provided herein. Unless otherwise indicated, market analysis and conclusions are based upon opinions or assumptions that Zacks Investment Management considers to be reasonable. Any investment inherently involves a high degree of risk, beyond any specific risks discussed herein.
The S&P 500 Index is a well-known, unmanaged index of the prices of 500 large-company common stocks, mainly blue-chip stocks, selected by Standard & Poor’s. The S&P 500 Index assumes reinvestment of dividends but does not reflect advisory fees. The volatility of the benchmark may be materially different from the individual performance obtained by a specific investor. An investor cannot invest directly in an index.