Economists, experts, and the financial media have been warning for over a year that a U.S. recession is ‘just around the corner.’ The economy continues telling a different story.
Last month, the Bureau of Labor Statistics reported that payrolls grew by 339,000, with the previous month’s job growth being revised higher by 93,000. Workers are making more money, too – wages grew by 0.3% in May and 4% year-over-year, frustrating the Fed while showing little sign of deceleration. In all, real U.S. GDP grew by 1.1% in Q1 2023 (advance estimate) and 2.6% in Q4 2022, which all readers know isn’t the stuff of recessions.1
To be fair, recession forecasts have not been unfounded. In past columns, I’ve pointed to the inverted yield curve as a historical precursor to economic downturns, and the spread between the yield on the 3-month U.S. Treasury and the 10-year U.S. Treasury has been in firmly negative territory for months now (see chart below). I’ve also pointed out that the Conference Board Leading Economic Index (LEI) has decisively turned over—now down 4.4% over the six months from October 2022 to April 2023—which has preceded the last several recessions.
Yield Curve Inversions Tend to Precede Recessions
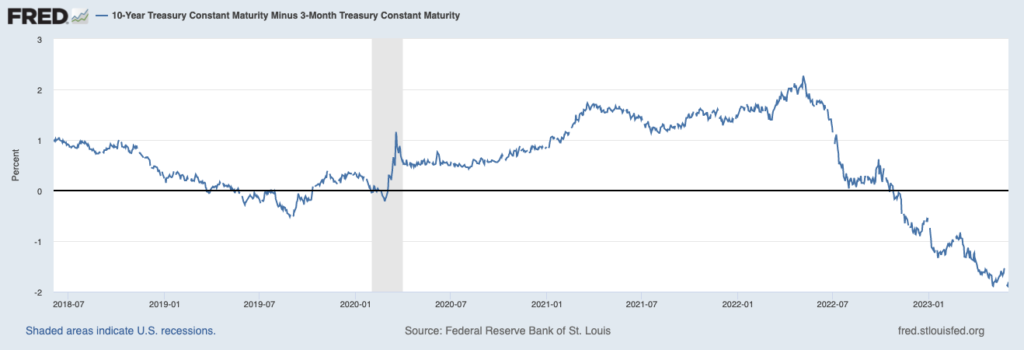
Source: Federal Reserve Bank of St. Louis2
Now there’s yet another signal flashing recession – the U.S. debt markets. Readers should broadly think about the debt market as one responsible for moving money from banks and lenders to businesses and households, which is of course paramount to driving economic activity and new spending and investment.
In the wake of the Fed’s interest rate hiking campaign and the regional bank stress this spring – the two of which are related – we’re starting to notice banks requiring more collateral from borrowers as well as charging higher interest rates on loans. Lending conditions for companies, households, and especially real estate developers are now nearly as tight as they were at the height of the pandemic.
In the corporate world, sales of new bonds have fallen fairly dramatically, and corporate bankruptcy filings are also starting to rise as cash dries up, with the highest number of filings since 2010.
For households, interest rates are on the rise for credit cards, auto loans, and of course mortgages. Higher rates have also taken a toll on loans with adjustable interest rates, which we think has factored into more households falling behind on payments. As seen in the chart below, delinquency rates on consumer loans are on the rise:
Delinquency Rates on Consumer Loans
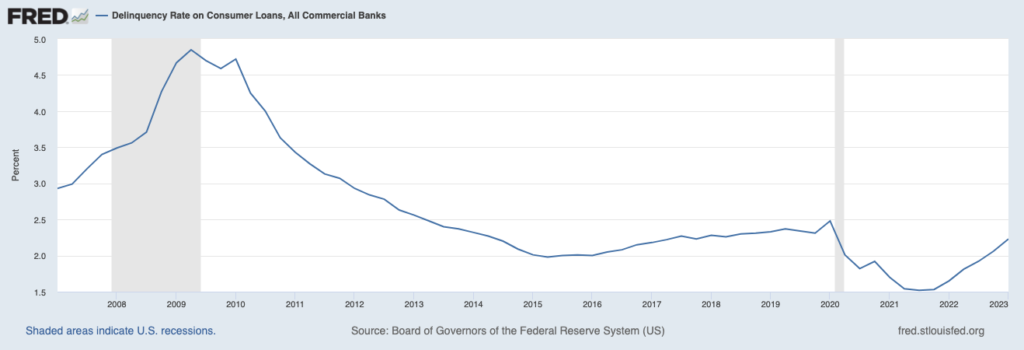
Source: Federal Reserve Bank of St. Louis3
Nowhere has credit tightening been more apparent than in the commercial real estate market, however. In the realm of office space, landlords are not only collecting less revenue from tenants who are not returning to offices, but they are also facing higher interest expenses. Banks surveying the environment don’t like what they see – the ratio of money lent to property value has fallen to a 30-year low, and the debt markets are signaling the trouble. Commercial mortgage-backed bonds with AAA credit ratings currently pay ~2% higher yields than comparable U.S. Treasury bonds.
Bottom Line for Investors
The aforementioned tightness in debt markets is yet another signal that a recession appears likely for the U.S. sometime in 2023 or early 2024. Frustrating many forecasters, however, is the flip side of the argument which has been the same for the past year – a strong jobs market and higher wages may continue to be enough to stave off a downturn. The U.S. consumer is the most important component of the U.S. economy, and to date ‘full employment’ and higher wages have been enough to keep spending afloat.
Whether the consumer can continue to keep the U.S. economy growing in 2023 remains to be seen. For markets though, it may not matter. I would argue a recession has been priced into stocks for some time now, and only a worse-an-expected downturn would be enough to send stocks tumbling again. A recession that’s more ‘garden variety,’ which is what I’d expect, would probably not negatively impact stocks much at all, in my view. That type of recession is already too widely known and expected.
Disclosure
2 Fred Economic Data. June 2, 2023. https://fred.stlouisfed.org/series/T10Y3M#
3 Wall Street Journal. May 31, 2023. https://www.wsj.com/articles/where-is-the-u-s-economy-headed-follow-the-money-c79a6b1c
DISCLOSURE
Past performance is no guarantee of future results. Inherent in any investment is the potential for loss.
Zacks Investment Management, Inc. is a wholly-owned subsidiary of Zacks Investment Research. Zacks Investment Management is an independent Registered Investment Advisory firm and acts as an investment manager for individuals and institutions. Zacks Investment Research is a provider of earnings data and other financial data to institutions and to individuals.
This material is being provided for informational purposes only and nothing herein constitutes investment, legal, accounting or tax advice, or a recommendation to buy, sell or hold a security. Do not act or rely upon the information and advice given in this publication without seeking the services of competent and professional legal, tax, or accounting counsel. Publication and distribution of this article is not intended to create, and the information contained herein does not constitute, an attorney-client relationship. No recommendation or advice is being given as to whether any investment or strategy is suitable for a particular investor. It should not be assumed that any investments in securities, companies, sectors or markets identified and described were or will be profitable. All information is current as of the date of herein and is subject to change without notice. Any views or opinions expressed may not reflect those of the firm as a whole.
Any projections, targets, or estimates in this report are forward looking statements and are based on the firm’s research, analysis, and assumptions. Due to rapidly changing market conditions and the complexity of investment decisions, supplemental information and other sources may be required to make informed investment decisions based on your individual investment objectives and suitability specifications. All expressions of opinions are subject to change without notice. Clients should seek financial advice regarding the appropriateness of investing in any security or investment strategy discussed in this presentation.
Certain economic and market information contained herein has been obtained from published sources prepared by other parties. Zacks Investment Management does not assume any responsibility for the accuracy or completeness of such information. Further, no third party has assumed responsibility for independently verifying the information contained herein and accordingly no such persons make any representations with respect to the accuracy, completeness or reasonableness of the information provided herein. Unless otherwise indicated, market analysis and conclusions are based upon opinions or assumptions that Zacks Investment Management considers to be reasonable. Any investment inherently involves a high degree of risk, beyond any specific risks discussed herein.
The S&P 500 Index is a well-known, unmanaged index of the prices of 500 large-company common stocks, mainly blue-chip stocks, selected by Standard & Poor’s. The S&P 500 Index assumes reinvestment of dividends but does not reflect advisory fees. The volatility of the benchmark may be materially different from the individual performance obtained by a specific investor. An investor cannot invest directly in an index.
The Russell 1000 Growth Index is a well-known, unmanaged index of the prices of 1000 large-company growth common stocks selected by Russell. The Russell 1000 Growth Index assumes reinvestment of dividends but does not reflect advisory fees. An investor cannot invest directly in an index. The volatility of the benchmark may be materially different from the individual performance obtained by a specific investor.
Nasdaq Composite Index is the market capitalization-weighted index of over 3,300 common equities listed on the Nasdaq stock exchange. The types of securities in the index include American depositary receipts, common stocks, real estate investment trusts (REITs) and tracking stocks, as well as limited partnership interests. The index includes all Nasdaq-listed stocks that are not derivatives, preferred shares, funds, exchange-traded funds (ETFs) or debenture securities. An investor cannot invest directly in an index. The volatility of the benchmark may be materially different from the individual performance obtained by a specific investor.
The Dow Jones Industrial Average measures the daily stock market movements of 30 U.S. publicly-traded companies listed on the NASDAQ or the New York Stock Exchange (NYSE). The 30 publicly-owned companies are considered leaders in the United States economy. An investor cannot directly invest in an index. The volatility of the benchmark may be materially different from the individual performance obtained by a specific investor.
The Bloomberg Global Aggregate Index is a flagship measure of global investment grade debt from twenty-four local currency markets. This multi-currency benchmark includes treasury, government-related, corporate and securitized fixed-rate bonds from both developed and emerging markets issuers. An investor cannot invest directly in an index. The volatility of the benchmark may be materially different from the individual performance obtained by a specific investor.
The ICE Exchange-Listed Fixed & Adjustable Rate Preferred Securities Index is a modified market capitalization weighted index composed of preferred stock and securities that are functionally equivalent to preferred stock including, but not limited to, depositary preferred securities, perpetual subordinated debt and certain securities issued by banks and other financial institutions that are eligible for capital treatment with respect to such instruments akin to that received for issuance of straight preferred stock. An investor cannot invest directly in an index. The volatility of the benchmark may be materially different from the individual performance obtained by a specific investor.
The MSCI ACWI ex U.S. Index captures large and mid-cap representation across 22 of 23 Developed Markets (DM) countries (excluding the United States) and 24 Emerging Markets (EM) countries. The index covers approximately 85% of the global equity opportunity set outside the U.S. An investor cannot invest directly in an index. The volatility of the benchmark may be materially different from the individual performance obtained by a specific investor.