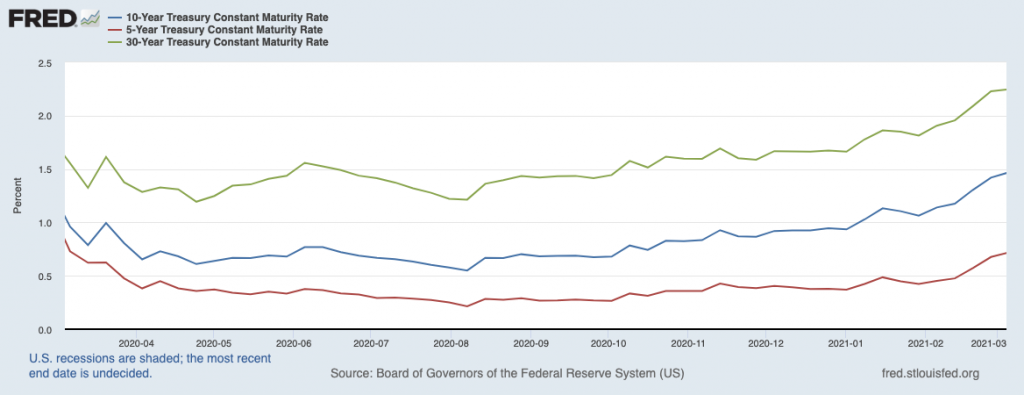
U.S. Treasury bonds have been locked in a six-week selloff, with yields moving steadily higher as prices fall. The 10-year U.S. Treasury bond yield started 2021 under 1%, but it has marched upwards ever since. The yield crossed 1.5% by the first week in March.1 Looking ahead, all signs point to even more upward pressure on long-dated U.S. Treasury bond yields this year. As you can see from the chart below, the 5-, 10-, and 30-year U.S. Treasury bond yields have all been drifting higher since last summer.
The 5-, 10-, and 30-year U.S. Treasury Bond Yields (March 2020 – March 2021)
__________________________________________________________________________
Prepare Your Investments for Inflation, Volatility and Other Uncertainties
With anticipation surrounding the next stimulus, expected economic growth and inflation expectations, there are many unknows surrounding the market. As we witness market changes, I understand how planning your future economic situation can cause lots of uncertainty. Instead of making sudden and emotional investment decisions, I recommend focusing more on the hard data and economic indicators that could impact your investments in the long-term!
To help you do this, I am offering all readers our just-released Stock Market Outlook report. This report contains some of our key forecasts to consider such as:
- Financial stability lessons from the COVID-19
- Setting U.S. returns expectations for 2021
- Outlooks for the underlying U.S. and Global Economies
- S&P 500 earnings growth
- What produces 2021 optimism?
- Is it time to buy U.S. stocks?
- Update on U.S. fiscal stimulus
- And much more…
If you have $500,000 or more to invest and want to learn more about these forecasts, click on the link below to get your free report today!
IT’S FREE. Download the Just-Released April 2021 Stock Market Outlook3
The conditions that generally lead to rising rates all apply to the current environment, in my view:
- Anticipation of large fiscal stimulus passing in the near-term;
- Accelerating economic growth expected in coming quarters (and perhaps years);
- Rising inflation expectations.
I’ll stop short of making any predictions about where the 10- or 30-year U.S. Treasury bond might finish the year. But from what I see today, the outlook is clear: longer-term interest rates are on the rise, and there are four key takeaways I think investors should consider. Here they are.4
Takeaway #1: High-Growth, High Valuation Stocks are Riskier
Many readers have probably seen the stories in the financial headlines: rising interest rates are putting pressure on technology stocks. Indeed, the tech-heavy Nasdaq entered correction territory last week, while the S&P 500 has fallen by only a modest amount over the same period. The question is, why do higher rates hurt tech stocks?
Here’s the simplest answer I can offer: when interest rates are very low, liquidity in the capital markets tends to flow into risk assets. Investors in search of yield know they can’t find any in U.S. Treasuries and most types of bonds, so they buy stocks. Since interest rates have been low for a long time, investors have been comfortable investing in high-growth/high-risk tech names, bidding up prices in the process.
However, as interest rates start to tick higher, stocks cease to be “the only game in town.” This means all the excess liquidity now has more places it can go, which diminishes the relative attractiveness of stocks, but especially the most expensive stocks. This does not necessarily imply that a tech bubble is about to burst – but it does mean the market may take some to adjust to higher rates, which could mean elevated volatility for high valuation names. Check your portfolio for exposure.
Takeaway #2: A Better Profit Outlook for Financials
Steep, upward sloping yield curves tend to be good news for banks, and the yield curve is currently getting steeper.
The chart below shows the 10-year U.S. Treasury bond yield minus the 3-month Treasury bond yield, which is a good barometer for the yield curve. When the line moves higher, the curve gets steeper:
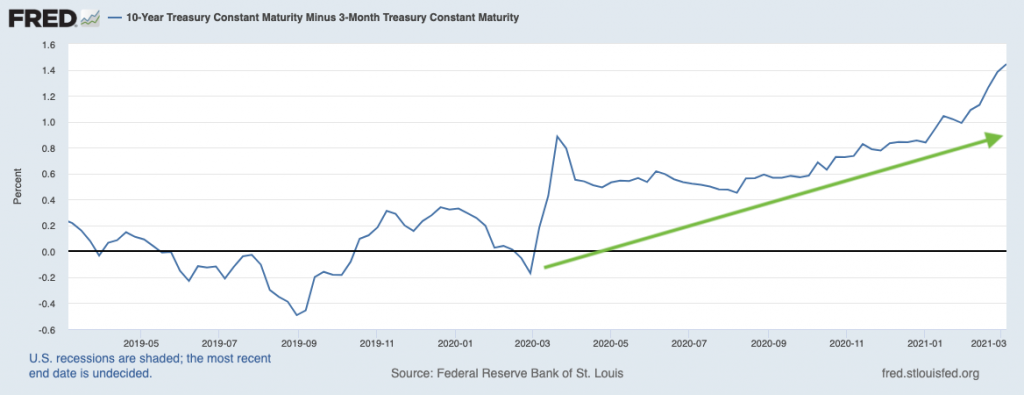
Steep yield curves are good for banks because of net interest margins on loans. When a bank makes a loan, it generally accesses capital at rates on the short end of the curve (basically free money currently) and loans the money out at longer-term rates. The steeper the yield curve, the bigger the difference between short and long rates, which also means bigger bank profits. The Financials sector has a favorable outlook as a result.
Takeaway #3: Capital May Rotate from Growth to Value
Over the last 10 years (through 2020), the Russell 1000 Growth Index has delivered an annualized return of around +17%, while the Russell 1000 Value Index has annualized about +10% over the same period. Since 2007, the outperformance of growth relative to value is approaching levels not seen since the 1930s and the dot com bubble. In fact, the spread between the price-to-earnings (P/E) ratio on growth and the P/E ratio on value stocks is the highest it has been since 2000, when the bubble burst on many growth names. As I mentioned before, I’m not suggesting we’ll see a tech bubble burst in 2021, but I do believe it is just matter of time before investors rotate capital away from growth and towards value. Rising interest rates may nudge this rotation along.6
I’ve already made the case for rising interest rates hurting tech stocks, which also means hurting the growth category. But rising inflation expectations play a role here too – upward pressure on inflation may eventually put some pressure on the Federal Reserve to tighten monetary policy, which recent history suggests could give way to market volatility and “taper tantrums.” As mentioned, selling pressure in response to higher inflation and tighter monetary policy will most likely impact areas of the market with relatively high P/E ratios. This could mean a reality check for growth stocks and could trigger an investor rotation into value.
Takeaway #4: Rethinking Retirement Fixed Income Allocations
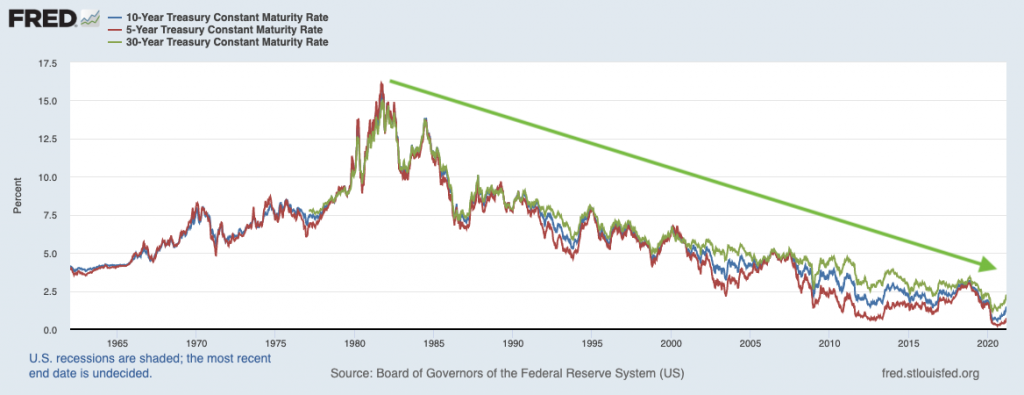
I do not like making long-term forecasts for interest rates or the stock market. Anything can happen from year to year, so it’s important to assess as you go. It’s clear to me, however, that the outlook for risk-free fixed income, i.e. Treasuries, is looking bleak for current and future retirees. The bull market in Treasuries (from 1980 to recent years) is running out of steam, and investors will need to content with low yields that look poised to move higher. Remember, rising yields means falling prices.
I think current and future retirees need to rethink fixed income allocations in retirement portfolios, exploring different types of bonds like corporates and municipals, and also exploring income-generation via other avenues, like dividend stocks and preferred.
Bottom Line for Investors
As you can see from this lengthy column, rising interest rates have many implications for investors. In my view, now is a good time to take a closer look at your portfolio allocation, and to potentially make a few adjustments if your goals and risk tolerance allow. If you want some help conducting your portfolio review, reach out to us today. We’d be happy to help.
In addition to taking a close look at your portfolio, in times like these, it is important to stay focused on key data points and economic indicators that could positively impact your investments in the future. To guide you, I am offering all readers our Just-Released April 2021 Stock Market Outlook Report.
This report looks at several factors that are producing optimism right now and contains some of our key forecasts to consider such as:
- Financial stability lessons from the COVID-19
- Setting U.S. returns expectations for 2021
- Outlooks for the underlying U.S. and Global Economies
- S&P 500 earnings growth
- What produces 2021 optimism?
- Is it time to buy U.S. stocks?
- Update on U.S. fiscal stimulus
- And much more…
If you have $500,000 or more to invest and want to learn more about these forecasts, click on the link below to get your free report today!
Disclosure
2 Fred Economic Data. March 5, 2021. https://fred.stlouisfed.org/series/DGS10#0
3 Zacks Investment Management reserves the right to amend the terms or rescind the free Stock Market Outlook offer at any time and for any reason at its discretion.
4 Wall Street Journal. March 8, 2021. https://www.wsj.com/articles/global-stock-markets-dow-update-03-08-2021-11615192681?mod=hp_lead_pos1
5 Fred Economic Data. March 8, 2021. https://fred.stlouisfed.org/series/T10Y3M#0
6 Forbes. November 12, 2020. https://www.forbes.com/advisor/investing/value-vs-growth-stocks-performance/
7 Fred Economic Data. March 5, 2021. https://fred.stlouisfed.org/series/DGS10#0
8 Zacks Investment Management reserves the right to amend the terms or rescind the free Stock Market Outlook offer at any time and for any reason at its discretion.
DISCLOSURE
Past performance is no guarantee of future results. Inherent in any investment is the potential for loss.
Zacks Investment Management, Inc. is a wholly-owned subsidiary of Zacks Investment Research. Zacks Investment Management is an independent Registered Investment Advisory firm and acts as an investment manager for individuals and institutions. Zacks Investment Research is a provider of earnings data and other financial data to institutions and to individuals.
This material is being provided for informational purposes only and nothing herein constitutes investment, legal, accounting or tax advice, or a recommendation to buy, sell or hold a security. Do not act or rely upon the information and advice given in this publication without seeking the services of competent and professional legal, tax, or accounting counsel. Publication and distribution of this article is not intended to create, and the information contained herein does not constitute, an attorney-client relationship. No recommendation or advice is being given as to whether any investment or strategy is suitable for a particular investor. It should not be assumed that any investments in securities, companies, sectors or markets identified and described were or will be profitable. All information is current as of the date of herein and is subject to change without notice. Any views or opinions expressed may not reflect those of the firm as a whole.
Any projections, targets, or estimates in this report are forward looking statements and are based on the firm’s research, analysis, and assumptions. Due to rapidly changing market conditions and the complexity of investment decisions, supplemental information and other sources may be required to make informed investment decisions based on your individual investment objectives and suitability specifications. All expressions of opinions are subject to change without notice. Clients should seek financial advice regarding the appropriateness of investing in any security or investment strategy discussed in this presentation.
Certain economic and market information contained herein has been obtained from published sources prepared by other parties. Zacks Investment Management does not assume any responsibility for the accuracy or completeness of such information. Further, no third party has assumed responsibility for independently verifying the information contained herein and accordingly no such persons make any representations with respect to the accuracy, completeness or reasonableness of the information provided herein. Unless otherwise indicated, market analysis and conclusions are based upon opinions or assumptions that Zacks Investment Management considers to be reasonable. Any investment inherently involves a high degree of risk, beyond any specific risks discussed herein.
The S&P 500 Index is a well-known, unmanaged index of the prices of 500 large-company common stocks, mainly blue-chip stocks, selected by Standard & Poor’s. The S&P 500 Index assumes reinvestment of dividends but does not reflect advisory fees. The volatility of the benchmark may be materially different from the individual performance obtained by a specific investor. An investor cannot invest directly in an index.
The Russell 1000 Growth Index is a well-known, unmanaged index of the prices of 1000 large-company growth common stocks selected by Russell. The Russell 1000 Growth Index assumes reinvestment of dividends but does not reflect advisory fees. An investor cannot invest directly in an index. The volatility of the benchmark may be materially different from the individual performance obtained by a specific investor.
Nasdaq Composite Index is the market capitalization-weighted index of over 3,300 common equities listed on the Nasdaq stock exchange. The types of securities in the index include American depositary receipts, common stocks, real estate investment trusts (REITs) and tracking stocks, as well as limited partnership interests. The index includes all Nasdaq-listed stocks that are not derivatives, preferred shares, funds, exchange-traded funds (ETFs) or debenture securities. An investor cannot invest directly in an index. The volatility of the benchmark may be materially different from the individual performance obtained by a specific investor.
The Dow Jones Industrial Average measures the daily stock market movements of 30 U.S. publicly-traded companies listed on the NASDAQ or the New York Stock Exchange (NYSE). The 30 publicly-owned companies are considered leaders in the United States economy. An investor cannot directly invest in an index. The volatility of the benchmark may be materially different from the individual performance obtained by a specific investor.
Returns for each strategy and the corresponding Morningstar Universe reflect the annualized returns for the periods indicated. The Morningstar Universes used for comparative analysis are constructed by Morningstar (median performance) and data is provided to Zacks by Zephyr Style Advisor. The percentile ranking for each Zacks Strategy is based on the gross comparison for Zacks Strategies vs. the indicated universe rounded up to the nearest whole percentile. Other managers included in universe by Morningstar may exhibit style drift when compared to Zacks Investment Management portfolio. Neither Zacks Investment Management nor Zacks Investment Research has any affiliation with Morningstar. Neither Zacks Investment Management nor Zacks Investment Research had any influence of the process Morningstar used to determine this ranking.
The Russell 1000 Value Index is a well-known, unmanaged index of the prices of 1000 large-company value common stocks selected by Russell. The Russell 1000 Value Index assumes reinvestment of dividends but does not reflect advisory fees. An investor cannot directly invest in an index. The volatility of the benchmark may be materially different from the individual performance obtained by a specific investor.