In the second quarter, S&P 500 corporate earnings were down over -30% on approximately -10% lower revenues.1 Daily confirmed cases of Covid-19 in the United States continue at a pace in-line with early days of the outbreak, and the Bureau of Labor Statistics’ July unemployment report showed 16+ million unemployed Americans with an unemployment rate of 10.2%.2
Meanwhile, the S&P Index is trading at all-time highs.
S&P 500 Since 2018: Volatile, But Still at All-Time Highs
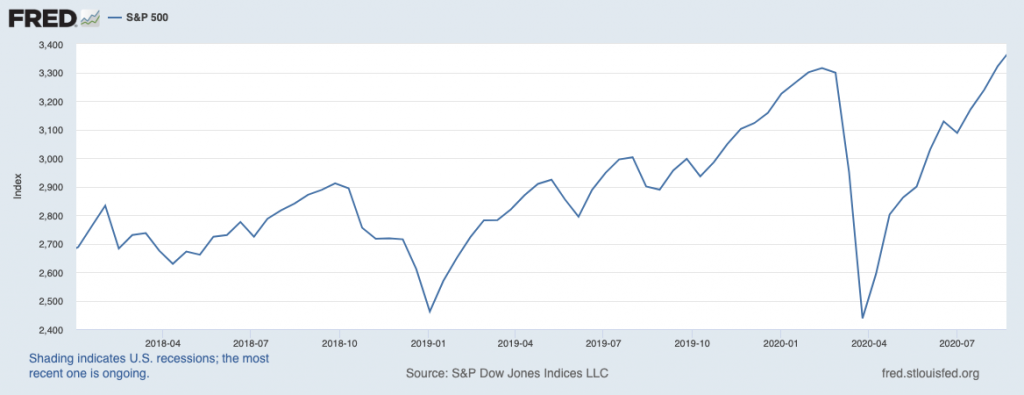
I have written before about this seeming disconnect between what the stock market is doing and what we’re seeing in the U.S. economy and in the news. In my view, the stock market is arguably pricing-in what the economy will look like a year from now, and what the market sees is significant pent-up demand, a fading pandemic-induced economic impact, and a wall of liquidity coursing its way through capital markets.
The question I want to address is this column, however, is whether investors should be concerned about the U.S. stock market hitting all-time highs with the economy still bruised and slowly recovering. Does the market reaching all-time highs mean a crash or major correction is coming?
_____________________________________________________________________________
What Could These All-Time Highs Mean for the Future of the Market?
Could all-time highs mean a correction or crash is on the horizon? It is impossible to know the end-result with complete certainty. But looking at hard data and economic fundamentals can help you understand better the current market environment.
To help you get a deeper look into this data, I am offering all readers our just-released Stock Market Outlook report. This report contains some of our key forecasts to consider such as:
- What’s ‘Fair Value’ on the S&P500?
- Setting U.S. returns expectations for the remainder of 2020
- What should you think about COVID19 era jobs data?
- An update on U.S. fiscal stimulus
- Zacks Rank S&P 500 sector picks
- Status of global energy markets
- And much more
If you have $500,000 or more to invest and want to learn more about these forecasts, click on the link below to get your free report today!
IT’S FREE. Download the Just-Released September 2020 Stock Market Outlook3
_____________________________________________________________________________
No one truly knows the answer to that question. We know that market corrections and bear markets are normal and common, but we do not know when they will arrive or how long they will last. If anyone tells you ‘with certainty’ when market downside is coming and how long it will last, my advice is to run the other way.
In thinking about where the markets and economy could go in the next year and beyond, I find it useful to break it down by key category:
- Economics – The pandemic-induced recession was steep and ugly. But I think there is a good argument that the worst of the crisis is now behind us. Manufacturing and services activity have rebounded firmly off lows, the housing market has seen very solid activity, and spending has outpaced expectations. In other words, with the second quarter as a starting point, I expect the economy to grow and for the employment situation to gradually improve.
- Earnings – Second quarter earnings were bad, plain and simple. But at the same time, I would argue that earnings were not as bad as expected, and stocks love positive surprises. Indeed, 80.0% of S&P 500 companies beat earnings-per-share estimates and 62.9% beat revenue estimates in Q2, both firmly above historical averages for beat percentages.5 Will earnings continue to improve going forward? I think so.
- Interest Rates – Overnight rates in most developed countries are near historic lows, meaning that borrowing costs and financing costs are highly attractive for businesses and individuals that can obtain loans. Central banks around the world also appear poised to keep interest rates low for years to come, which makes equities attractive by comparison, in my view.
- Inflation – The amount of global stimulus is absolutely massive, and by comparison, it is many times bigger than the stimulus deployed in the late stages of the 2008 Financial Crisis in 2008-09. It is a bit crazy to fathom, but the total global fiscal and monetary stimulus being deployed amounts to approximately 28% of world GDP.6 This ‘wall of liquidity’ makes inflation seem more likely in the coming years, and will be a factor to watch.
- Sentiment – I think consumer and investor sentiment is improving in the wake of the pandemic but may sour as the election nears. The mixed bag on sentiment may be ok for stocks, ultimately – not too hot, not too cold.
Bottom Line for Investors
The nature of bull markets is that we can expect the stock market to reach new highs over time. It is what history tells us to expect every time.
As such, I would caution against seeing an all-time high as a reason to go defensive or to take profits off the table. For one, selling into the market’s strength is a form of market timing, which I do not advocate. But more importantly, when setting a long-term investment strategy, it is important to consider how the economy may grow or contract in the next six, twelve, even 18 months. In my view, the economy one year from now will be in better shape than it is today, and owning stocks means participating in the growth that happens between now and then.
No one knows with certainty what is in store for the future of the market. But, paying attention to key data can help you make educated investment decisions. To help you do this, I am offering all readers our Just-Released September 2020 Stock Market Outlook Report.
This report looks at the key economic indicators and highlights several factors that are producing 2020 optimism right now and contains some of our key forecasts to consider such as:
- What’s ‘Fair Value’ on the S&P500?
- Setting U.S. returns expectations for the remainder of 2020
- What should you think about COVID19 era jobs data?
- An update on U.S. fiscal stimulus
- Zacks Rank S&P 500 sector picks
- Status of global energy markets
- And much more
If you have $500,000 or more to invest and want to learn more about these forecasts, click on the link below to get your free report today!7
Disclosure
2 U.S. Bureau of Labor Statistics, August 7, 2020. https://www.bls.gov/news.release/empsit.nr0.htm
3 S&P Dow Jones Indices LLC, S&P 500 [SP500], retrieved from FRED, Federal Reserve Bank of St. Louis; https://fred.stlouisfed.org/series/SP500, August 24, 2020.
4 Zacks Investment Management reserves the right to amend the terms or rescind the free Stock Market Outlook offer at any time and for any reason at its discretion.
5 Zacks.com, August 19, 2020. https://www.zacks.com/commentary/1044440/earnings-season-winding-down
6 Charles Schwab, June 15, 2020. https://www.schwab.com/resource-center/insights/content/2020-mid-year-outlook-us-stocks-and-economy
7 Zacks Investment Management reserves the right to amend the terms or rescind the free Stock Market Outlook offer at any time and for any reason at its discretion.
DISCLOSURE
Past performance is no guarantee of future results. Inherent in any investment is the potential for loss.
Zacks Investment Management, Inc. is a wholly-owned subsidiary of Zacks Investment Research. Zacks Investment Management is an independent Registered Investment Advisory firm and acts as an investment manager for individuals and institutions. Zacks Investment Research is a provider of earnings data and other financial data to institutions and to individuals.
This material is being provided for informational purposes only and nothing herein constitutes investment, legal, accounting or tax advice, or a recommendation to buy, sell or hold a security. Do not act or rely upon the information and advice given in this publication without seeking the services of competent and professional legal, tax, or accounting counsel. Publication and distribution of this article is not intended to create, and the information contained herein does not constitute, an attorney-client relationship. No recommendation or advice is being given as to whether any investment or strategy is suitable for a particular investor. It should not be assumed that any investments in securities, companies, sectors or markets identified and described were or will be profitable. All information is current as of the date of herein and is subject to change without notice. Any views or opinions expressed may not reflect those of the firm as a whole.
Any projections, targets, or estimates in this report are forward looking statements and are based on the firm’s research, analysis, and assumptions. Due to rapidly changing market conditions and the complexity of investment decisions, supplemental information and other sources may be required to make informed investment decisions based on your individual investment objectives and suitability specifications. All expressions of opinions are subject to change without notice. Clients should seek financial advice regarding the appropriateness of investing in any security or investment strategy discussed in this presentation.
Certain economic and market information contained herein has been obtained from published sources prepared by other parties. Zacks Investment Management does not assume any responsibility for the accuracy or completeness of such information. Further, no third party has assumed responsibility for independently verifying the information contained herein and accordingly no such persons make any representations with respect to the accuracy, completeness or reasonableness of the information provided herein. Unless otherwise indicated, market analysis and conclusions are based upon opinions or assumptions that Zacks Investment Management considers to be reasonable. Any investment inherently involves a high degree of risk, beyond any specific risks discussed herein.
The S&P 500 Index is a well-known, unmanaged index of the prices of 500 large-company common stocks, mainly blue-chip stocks, selected by Standard & Poor’s. The S&P 500 Index assumes reinvestment of dividends but does not reflect advisory fees. The volatility of the benchmark may be materially different from the individual performance obtained by a specific investor. An investor cannot invest directly in an index.
The Russell 1000 Growth Index is a well-known, unmanaged index of the prices of 1000 large-company growth common stocks selected by Russell. The Russell 1000 Growth Index assumes reinvestment of dividends but does not reflect advisory fees. An investor cannot invest directly in an index. The volatility of the benchmark may be materially different from the individual performance obtained by a specific investor.
Nasdaq Composite Index is the market capitalization-weighted index of over 3,300 common equities listed on the Nasdaq stock exchange. The types of securities in the index include American depositary receipts, common stocks, real estate investment trusts (REITs) and tracking stocks, as well as limited partnership interests. The index includes all Nasdaq-listed stocks that are not derivatives, preferred shares, funds, exchange-traded funds (ETFs) or debenture securities. An investor cannot invest directly in an index. The volatility of the benchmark may be materially different from the individual performance obtained by a specific investor.