What Rising Corporate Debt Defaults Tell Us About the Economy
For the past couple of years, investors and analysts have been debating how higher interest rates and the possibility of a recession would ripple through corporate debt markets. A major concern was the so-called “maturity wall” of debt coming due. Many corporations—especially those in the high-yield category—were likely facing the painful reality of having to refinance ‘cheap’ (post-pandemic, pre-inflation) debt at much higher rates.
In a sense, some of these fears and concerns have come to fruition. In 2023, corporate debt defaults rose to 153 (from 85 in 2022), and through mid-March, the tally was already at 29—the highest Q1 total since the Global Financial Crisis. The numbers alone suggest that corporations are having trouble accessing debt markets, and are struggling to generate the cash flow needed to pay interest due on debt, or both.1
But there’s more to the story beyond these numbers.
When investors want to check in on corporate financial health, they should generally start with credit markets. The question to pose is: what is the implied cost of refinancing bonds, both for investment-grade corporations and the high-yield/junk category? One might expect that with rising defaults and higher interest rates, refinancing debt is not only more expensive but also quite prohibitive for many.
Corporate Debt Defaults Pose a Risk, but What About Current Market Opportunities?
Credit markets are important to monitor closely, but there are myriad other economic fundamentals and longer-term market trends to watch. To help readers gain a fuller picture of what’s driving markets today, I am offering our free April 2024 Stock Market Outlook. This report highlights key opportunities in equity markets today, including which sectors look very attractive versus those that should be approached with caution.
Additionally, you’ll gain access to detailed insights, such as:
• U.S. macro-outlook- San Francisco Fed “Fed views”
• March sell-side and buy-side consensus at a glance
• Zacks Rank S&P500 sector picks
• Top-down S&P500 yearend 2023 and 2024 targets
• Zacks rank March industry tables
• And much more!
If you have $500,000 or more to invest and want ideas on how to invest in a strong market, click on the link below to get your free report today!
IT’S FREE. Download the April 2024 Stock Market Outlook2
Credit spreads tell us otherwise.
For junk-rated bonds, the implied cost of refinancing bonds is at its lowest level since May of 2022, and investment-grade bonds are at their cheapest since the summer of 2022. As seen in the chart below, credit spreads appear to be locked in a downward trend, having weathered the Fed’s aggressive rate hike campaign and the regional bank stress one year ago.
High Yield Option-Adjusted Spread (red line) & Baa Corporate Bond Yield Relative to 10-Year U.S. Treasury (blue line)
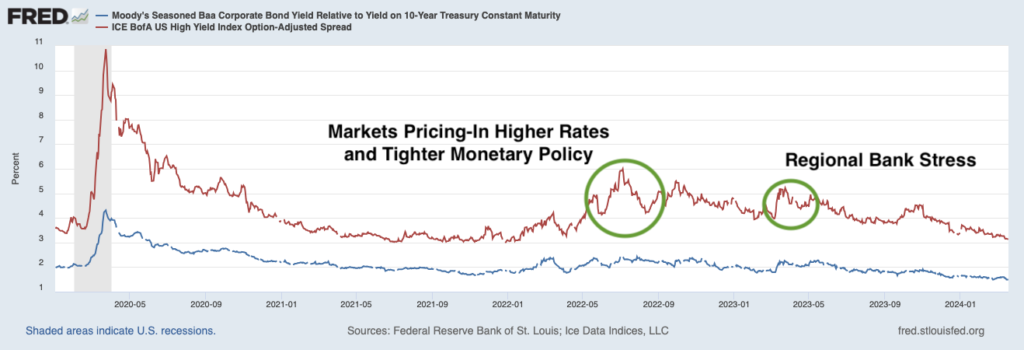
It follows that on average, a company issuing junk bonds today to replace maturing bonds would only be adding about 175 basis points to its annual interest bill, compared to nearly 500 basis points if the company refinanced in October 2022. The picture for investment-grade bonds looks similar.
If we take the above chart and zoom out to look back at the past 25+ years, it becomes apparent that spreads are not only at historically low levels, they are also at levels that corresponded to strong economic growth previously.
High-Yield and Baa Corporate Bond Spreads (1998 – Present)

Readers may wonder: if credit spreads are so low and corporate debt markets are seeing a flurry of activity, then how do you explain the rise of defaults in 2023 and year-to-date 2024?
The answer is that credit markets give us insight into present and future conditions for corporations, while defaults tell us more about the past—i.e., how a recession or tighter financial conditions ultimately affected businesses. In other words, recent defaults are telling us how industry struggles and Fed rate hikes in 2022 and 2023 ultimately caused a handful of companies to buckle, while credit spreads (the market) help us understand what corporations are experiencing today and what lies ahead.
Bottom Line for Investors
Aiding in the positive environment for corporate borrowing has been the anticipation of rate cuts later this year. The hope for lower borrowing costs in the future has nudged many investors to take a risk-on mindset in corporate bond markets, and companies have been responding in kind by issuing more debt—the supply of corporate bonds globally is 30% higher in 2024 year-to-date as compared to the same period last year.
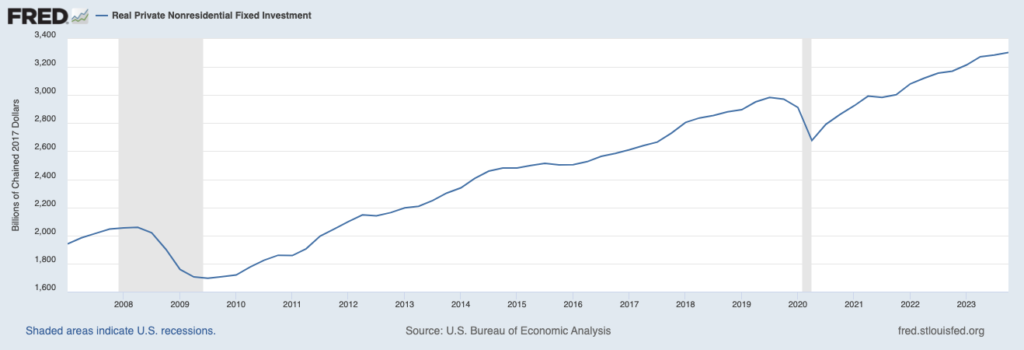
Overall, U.S. corporations remain in a strong financial position, as evidenced by record levels of investment (chart below), strong balance sheets, and projected earnings growth in 2024.
Corporate debt defaults could continue to rise as the year progresses, perhaps setting off some alarms in financial media. But as long as credit spreads remain relatively low, I think investors can reasonably interpret defaults as telling us what the economy endured in the past—not where it’s heading in the future.
Today, I am offering our free April 2024 Stock Market Outlook Report6, which gives investors our expert market commentary and the latest forecasts. You’ll receive information on:
• Zacks Rank S&P 500 sector picks
• Current asset allocation guidelines
• Zacks forecasts for the months ahead
• Zacks Rank industry tables
• Buy-side and sell-side consensus at a glance
• And much more!
If you have $500,000 or more to invest and want to learn more about our market forecasts for 2024, click on the link below to get your free report today!
Disclosure
2 Zacks Investment Management reserves the right to amend the terms or rescind the free-Stock Market Outlook Report offer at any time and for any reason at its discretion.
3 Fred Economic Data. March 18, 2024. https://fred.stlouisfed.org/series/BAA10Y#
4 Fred Economic Data. March 18, 2024. https://fred.stlouisfed.org/series/BAA10Y#
5 Fred Economic Data. February 28, 2024. https://fred.stlouisfed.org/series/PNFIC1#
6 Zacks Investment Management reserves the right to amend the terms or rescind the free-Stock Market Outlook Report offer at any time and for any reason at its discretion.
DISCLOSURE
Past performance is no guarantee of future results. Inherent in any investment is the potential for loss.
Zacks Investment Management, Inc. is a wholly-owned subsidiary of Zacks Investment Research. Zacks Investment Management is an independent Registered Investment Advisory firm and acts as an investment manager for individuals and institutions. Zacks Investment Research is a provider of earnings data and other financial data to institutions and to individuals.
This material is being provided for informational purposes only and nothing herein constitutes investment, legal, accounting or tax advice, or a recommendation to buy, sell or hold a security. Do not act or rely upon the information and advice given in this publication without seeking the services of competent and professional legal, tax, or accounting counsel. Publication and distribution of this article is not intended to create, and the information contained herein does not constitute, an attorney-client relationship. No recommendation or advice is being given as to whether any investment or strategy is suitable for a particular investor. It should not be assumed that any investments in securities, companies, sectors or markets identified and described were or will be profitable. All information is current as of the date of herein and is subject to change without notice. Any views or opinions expressed may not reflect those of the firm as a whole.
Any projections, targets, or estimates in this report are forward looking statements and are based on the firm’s research, analysis, and assumptions. Due to rapidly changing market conditions and the complexity of investment decisions, supplemental information and other sources may be required to make informed investment decisions based on your individual investment objectives and suitability specifications. All expressions of opinions are subject to change without notice. Clients should seek financial advice regarding the appropriateness of investing in any security or investment strategy discussed in this presentation.
Certain economic and market information contained herein has been obtained from published sources prepared by other parties. Zacks Investment Management does not assume any responsibility for the accuracy or completeness of such information. Further, no third party has assumed responsibility for independently verifying the information contained herein and accordingly no such persons make any representations with respect to the accuracy, completeness or reasonableness of the information provided herein. Unless otherwise indicated, market analysis and conclusions are based upon opinions or assumptions that Zacks Investment Management considers to be reasonable. Any investment inherently involves a high degree of risk, beyond any specific risks discussed herein.
The S&P 500 Index is a well-known, unmanaged index of the prices of 500 large-company common stocks, mainly blue-chip stocks, selected by Standard & Poor’s. The S&P 500 Index assumes reinvestment of dividends but does not reflect advisory fees. The volatility of the benchmark may be materially different from the individual performance obtained by a specific investor. An investor cannot invest directly in an index.
The Russell 1000 Growth Index is a well-known, unmanaged index of the prices of 1000 large-company growth common stocks selected by Russell. The Russell 1000 Growth Index assumes reinvestment of dividends but does not reflect advisory fees. An investor cannot invest directly in an index. The volatility of the benchmark may be materially different from the individual performance obtained by a specific investor.
Nasdaq Composite Index is the market capitalization-weighted index of over 3,300 common equities listed on the Nasdaq stock exchange. The types of securities in the index include American depositary receipts, common stocks, real estate investment trusts (REITs) and tracking stocks, as well as limited partnership interests. The index includes all Nasdaq-listed stocks that are not derivatives, preferred shares, funds, exchange-traded funds (ETFs) or debenture securities. An investor cannot invest directly in an index. The volatility of the benchmark may be materially different from the individual performance obtained by a specific investor.
The Dow Jones Industrial Average measures the daily stock market movements of 30 U.S. publicly-traded companies listed on the NASDAQ or the New York Stock Exchange (NYSE). The 30 publicly-owned companies are considered leaders in the United States economy. An investor cannot directly invest in an index. The volatility of the benchmark may be materially different from the individual performance obtained by a specific investor.
The Bloomberg Global Aggregate Index is a flagship measure of global investment grade debt from twenty-four local currency markets. This multi-currency benchmark includes treasury, government-related, corporate and securitized fixed-rate bonds from both developed and emerging markets issuers. An investor cannot invest directly in an index. The volatility of the benchmark may be materially different from the individual performance obtained by a specific investor.
The ICE Exchange-Listed Fixed & Adjustable Rate Preferred Securities Index is a modified market capitalization weighted index composed of preferred stock and securities that are functionally equivalent to preferred stock including, but not limited to, depositary preferred securities, perpetual subordinated debt and certain securities issued by banks and other financial institutions that are eligible for capital treatment with respect to such instruments akin to that received for issuance of straight preferred stock. An investor cannot invest directly in an index. The volatility of the benchmark may be materially different from the individual performance obtained by a specific investor.
The MSCI ACWI ex U.S. Index captures large and mid-cap representation across 22 of 23 Developed Markets (DM) countries (excluding the United States) and 24 Emerging Markets (EM) countries. The index covers approximately 85% of the global equity opportunity set outside the U.S. An investor cannot invest directly in an index. The volatility of the benchmark may be materially different from the individual performance obtained by a specific investor.
The Russell 2000 Index is a well-known, unmanaged index of the prices of 2000 small-cap company common stocks, selected by Russell. The Russell 2000 Index assumes reinvestment of dividends but does not reflect advisory fees. An investor cannot invest directly in an index. The volatility of the benchmark may be materially different from the individual performance obtained by a specific investor.
The S&P Mid Cap 400 provides investors with a benchmark for mid-sized companies. The index, which is distinct from the large-cap S&P 500, is designed to measure the performance of 400 mid-sized companies, reflecting the distinctive risk and return characteristics of this market segment.
The S&P 500 Pure Value index is a style-concentrated index designed to track the performance of stocks that exhibit the strongest value characteristics by using a style-attractiveness-weighting scheme. An investor cannot directly invest in an index. The volatility of the benchmark may be materially different from the individual performance obtained by a specific investor.