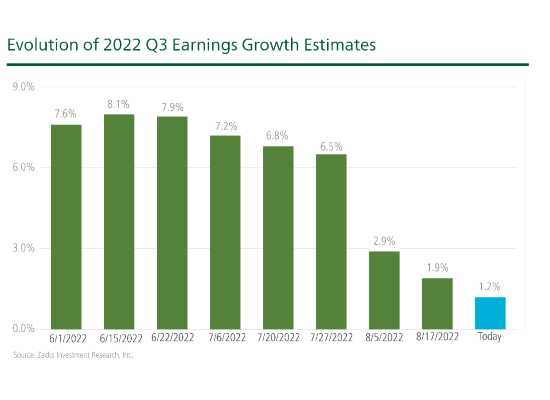
Earnings estimates for the second half of 2022 and full-year 2023 are marching lower. On July 1, earnings growth for S&P 500 companies was expected to be +7.6% for the third quarter. As I write, expected earnings growth has fallen to +1.2% for Q3, with the positive skew largely coming from big gains in the Energy sector. These are the biggest cuts (see chart below) to earnings estimates we’ve seen since Q2 2020, when analysts were scrambling to factor in the impact of the Covid-19 pandemic.1
______________________________________________________________________________________________________________
What Other Data Should You Be Watching?
In addition to earnings, there are other key economic indicators investors should keep an eye on to better navigate the market and protect your investments for what’s to come.
Instead of making daily decisions based on “what if’s”, I am offering all readers our just-released Stock Market Outlook report. This report will help you keep an eye on economic data releases, earnings reports, and other key economic factors, such as:
- View on equity markets
- Zacks forecasts at a glance
- Fundamentals that the U.S. stock markets are pricing in
- What’s next for the market?
- And more…
If you have $500,000 or more to invest and want to learn more about these forecasts, click on the link below to get your free report today!
IT’S FREE. Download the Just-Released October 2022 Stock Market Outlook3
___________________________________________________________________________
Q3 earnings estimates have been cut for 14 of the 16 Zacks’ sectors over the past several weeks, with the biggest declines coming in Consumer Discretionary, Consumer Staples, Technology and Retail. Given the U.S.’s status as a service and consumption-based economy, these are key sectors where we generally don’t want to see earnings coming down. It’s also worth noting that nearly half of S&P 500 companies mentioned ‘recession’ on their post-earnings conference calls in Q2, which is far more than we see in a typical quarter.3
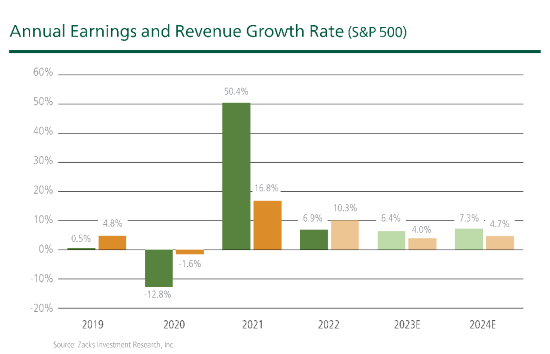
Earnings weakness is expected to persist in Q4 and into 2023, with estimates in decline for these periods as well. As you can see on the chart below, there is still a consensus that we’ll see earnings growth this year and next – it’s just much slower growth than was anticipated at the beginning of the year.
Analysts and market participants have been factoring in the earnings impact of rising interest rates and sticky inflation, and how the two are coming together to possibly push the U.S. into a recession. Even a stronger dollar has many analysts worried, as it can adversely affect sales that multinationals make abroad. While caution over corporate profitability started to appear in earnest in Q2, it has hit stride over the last few weeks.
Investors who have been following these earnings trends or are perhaps reading about them now may be thinking: this can’t be good for markets going forward. There is a growing sense that falling earnings and earnings estimates must mean falling stocks, which for some investors also means considering changes to portfolio positioning.
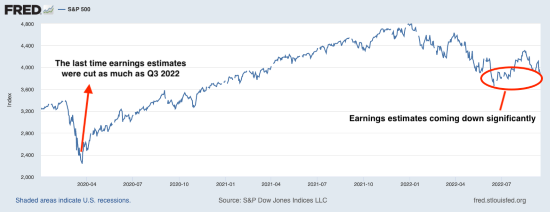
But that’s not really how markets work. For one, U.S. stocks are already in a bear market, so weaker economic and earnings growth ahead is likely being priced into stocks now, at least to a degree. Consider what happened with earnings estimates in the early days of the pandemic. In the beginning of Q2 2020 – which was the last time earnings estimates fell by as much as they are falling now (see chart below) – analysts were slashing earnings forecasts to factor in the impact of the pandemic. But by the time earnings estimates started coming down, the bear market was already over:
Analysts are now starting to factor in the impact of higher rates on spending and earnings, but I would argue that the impact on markets has already been felt to a large degree. I would also expect the market to rally when expectations and sentiment about earnings and the economy are low and/or falling, which is what we’ve been seeing over the past few weeks. There’s an old saying that “bull markets are born on pessimism,” which is what I think investors should be looking for now.
Bottom Line for Investors
Earnings gloom is gaining steam in Q3, which is arguably helping U.S. corporations since falling expectations mean there is a lower hurdle to clear for companies to do better than expected. That’s what we saw in Q2, when companies proved pretty resilient in the face of inflation and weaker growth, and the earnings season turned out to be better than expected (with stocks holding up over the summer months). We’re likely to continue seeing estimates coming down in future weeks and months, but I don’t see an action item for investors – much of this weakness is already priced in.
To help you get a better look at data that can help you protect your investments through market changes, I am offering all readers our Just-Released October 2022 Stock Market Outlook Report, which contains some of our key forecasts and factors to consider such as:
- Sell-Side and Buy-Side Consensus
- Zacks Rank August Industry Tables
- Zacks Forecasts at a Glance
- What’s Next for the Market?
- And more…
If you have $500,000 or more to invest and want to learn more about these forecasts, click on the link below to get your free report today!
Disclosure
2 Zacks Investment Management reserves the right to amend the terms or rescind the free-Stock Market Outlook Report offer at any time and for any reason at its discretion.
3 Wall Street Journal. September 12, 2022. https://www.wsj.com/articles/sliding-earnings-forecasts-pose-next-test-for-markets-11662907853?mod=markets_lead_pos2
4 Zacks Investment Management reserves the right to amend the terms or rescind the free-Stock Market Outlook Report offer at any time and for any reason at its discretion.
DISCLOSURE
Past performance is no guarantee of future results. Inherent in any investment is the potential for loss.
Past performance is no guarantee of future results. Performance is presented net of fees. Except as otherwise noted below, net of fees performance is based on the maximum annual fee of 1.75%. Lower fees may apply for larger accounts. Higher fees may apply to smaller accounts. Separately managed account minimums apply. Inherent in any investment is the potential for loss. Standard management fees are available on request and are described in Part 2A of Form ADV.
Results for Zacks Preferred Strategy (the “Strategy”) are shown net of fees. Results for the Strategy reflect the reinvestment of dividends and other earnings. The results portrayed is the performance history of a composite of all discretionary accounts with no material investment restrictions, which are not restrained by investment style, type of security, industry/sector, location, size or market cap; it invests primarily in U.S. common stocks.
Prospective clients and clients should not assume identical performance results to those shown would have been achieved for their account if it was invested in the Strategies during the period. Clients of the firm may receive different performance than the composite. Client performance may differ due to factors such as timing of investment(s), timing of withdrawal(s), and client[1]mandated investment restrictions. Wholesale, retail and institutional clients of the firm may have differing performance due to timing of trades.
Investments in the Strategies are not deposits of any bank, are not guaranteed by any bank, are not insured by FDIC or any other agency, and involve investment risks, including possible loss of the principal amount invested.
Clients of the firm who invest in multiple Strategies, including Strategies whose results are presented, may receive different performance than the composite due to differences between the investments of the Strategies and differences in each client’s asset allocation between the Strategies. Clients of the firm may also experience differing results from the composite due to differences in contributions to and withdrawals from the client’s account compared to the composite account.
Zacks Investment Management, Inc. is a wholly-owned subsidiary of Zacks Investment Research. Zacks Investment Management is an independent Registered Investment Advisory firm and acts as an investment manager for individuals and institutions. Zacks Investment Research is a provider of earnings data and other financial data to institutions and to individuals.
This material is being provided for informational purposes only and nothing herein constitutes investment, legal, accounting or tax advice, or a recommendation to buy, sell or hold a security. Do not act or rely upon the information and advice given in this publication without seeking the services of competent and professional legal, tax, or accounting counsel. Publication and distribution of this article is not intended to create, and the information contained herein does not constitute, an attorney-client relationship. No recommendation or advice is being given as to whether any investment or strategy is suitable for a particular investor. It should not be assumed that any investments in securities, companies, sectors or markets identified and described were or will be profitable. All information is current as of the date of herein and is subject to change without notice. Any views or opinions expressed may not reflect those of the firm as a whole.
Any projections, targets, or estimates in this report are forward looking statements and are based on the firm’s research, analysis, and assumptions. Due to rapidly changing market conditions and the complexity of investment decisions, supplemental information and other sources may be required to make informed investment decisions based on your individual investment objectives and suitability specifications. All expressions of opinions are subject to change without notice. Clients should seek financial advice regarding the appropriateness of investing in any security or investment strategy discussed in this presentation.
Certain economic and market information contained herein has been obtained from published sources prepared by other parties. Zacks Investment Management does not assume any responsibility for the accuracy or completeness of such information. Further, no third party has assumed responsibility for independently verifying the information contained herein and accordingly no such persons make any representations with respect to the accuracy, completeness or reasonableness of the information provided herein. Unless otherwise indicated, market analysis and conclusions are based upon opinions or assumptions that Zacks Investment Management considers to be reasonable. Any investment inherently involves a high degree of risk, beyond any specific risks discussed herein.
The S&P 500 Index is a well-known, unmanaged index of the prices of 500 large-company common stocks, mainly blue-chip stocks, selected by Standard & Poor’s. The S&P 500 Index assumes reinvestment of dividends but does not reflect advisory fees. The volatility of the benchmark may be materially different from the individual performance obtained by a specific investor. An investor cannot invest directly in an index.
The Russell 1000 Growth Index is a well-known, unmanaged index of the prices of 1000 large-company growth common stocks selected by Russell. The Russell 1000 Growth Index assumes reinvestment of dividends but does not reflect advisory fees. An investor cannot invest directly in an index. The volatility of the benchmark may be materially different from the individual performance obtained by a specific investor.
Nasdaq Composite Index is the market capitalization-weighted index of over 3,300 common equities listed on the Nasdaq stock exchange. The types of securities in the index include American depositary receipts, common stocks, real estate investment trusts (REITs) and tracking stocks, as well as limited partnership interests. The index includes all Nasdaq-listed stocks that are not derivatives, preferred shares, funds, exchange-traded funds (ETFs) or debenture securities. An investor cannot invest directly in an index. The volatility of the benchmark may be materially different from the individual performance obtained by a specific investor.
The Dow Jones Industrial Average measures the daily stock market movements of 30 U.S. publicly-traded companies listed on the NASDAQ or the New York Stock Exchange (NYSE). The 30 publicly-owned companies are considered leaders in the United States economy. An investor cannot directly invest in an index. The volatility of the benchmark may be materially different from the individual performance obtained by a specific investor.
The Bloomberg Global Aggregate Index is a flagship measure of global investment grade debt from twenty-four local currency markets. This multi-currency benchmark includes treasury, government-related, corporate and securitized fixed-rate bonds from both developed and emerging markets issuers. An investor cannot invest directly in an index. The volatility of the benchmark may be materially different from the individual performance obtained by a specific investor.
The ICE Exchange-Listed Fixed & Adjustable Rate Preferred Securities Index is a modified market capitalization weighted index composed of preferred stock and securities that are functionally equivalent to preferred stock including, but not limited to, depositary preferred securities, perpetual subordinated debt and certain securities issued by banks and other financial institutions that are eligible for capital treatment with respect to such instruments akin to that received for issuance of straight preferred stock. An investor cannot invest directly in an index. The volatility of the benchmark may be materially different from the individual performance obtained by a specific investor.